LinkedIn Basics

Saad Mouaouine
Laatst bijgewerkt: 27 feb 2026
You’re posting on LinkedIn. The likes are coming in. And yet, you have no idea whether any of it is actually working.
That’s the real problem with LinkedIn analytics: not a lack of data, but too much of it, with no clear sense of what to prioritize. According to the Content Marketing Institute, only 51% of B2B marketers believe their organizations measure content performance effectively.
Here’s a straightforward framework for how to measure content performance on LinkedIn: three sections of metrics, clear benchmarks, and a simple way to turn data into better posts.
Short Answer: Likes and impressions feel good but rarely tell you anything useful. Track three things instead: visibility (are people seeing your content?), engagement quality (are they genuinely reacting?), and business impact (profile visits, DMs, and leads).
The first 90 minutes after posting determine most of your reach, so time your posts well and reply to early comments fast. Above 5.2% engagement rate means you're performing above average. Do a quick weekly check and a deeper monthly review. One variable at a time.
What Does Content Performance Actually Mean?
Content performance measures how well your posts achieve a defined goal, whether that’s reaching new audiences, generating engagement, or driving real business outcomes like profile visits, website traffic, or inbound leads.
The key word is “goal.” Without one, you’re just collecting numbers. Look at these two examples:
A post with 5,000 impressions and zero leads from your target audience underperformed.
A post with 800 impressions that sparked three direct messages from qualified prospects did exactly what it was supposed to.
Measuring content performance means tracking the right signals for your goal, not chasing every metric LinkedIn puts in front of you.
Why Do Most LinkedIn Metrics Mislead You?
LinkedIn metrics mislead you because the most visible numbers are often the least meaningful.
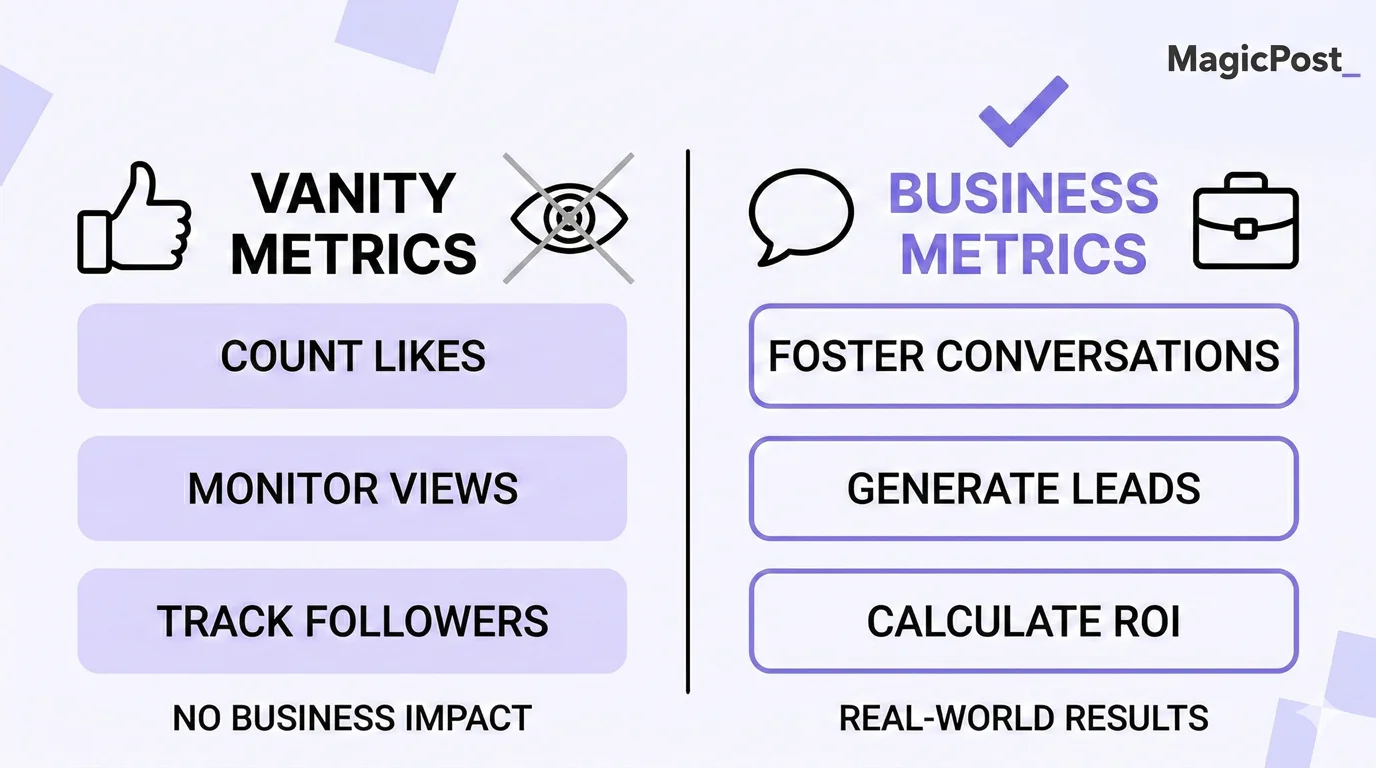
Here’s what you need to know:
Impressions tell you how many times your post appeared on a screen, not whether anyone read it.
Likes feel validating but carry the least algorithmic weight of any engagement type.
Follower count is almost entirely irrelevant to whether your content converts.
LinkedIn’s algorithm confirms this. According to Hootsuite’s LinkedIn Algorithm Guide, the platform specifically values meaningful engagement, especially thoughtful comments from people in relevant fields, over surface-level interactions. A post that sparks a real discussion consistently outperforms one with twice the likes but no conversation.
The fix is a simple framework that tells you which numbers to actually care about.
What Are the 3 Pillars of Content Performance That Actually Matter?
Think of LinkedIn content performance as three distinct pillars, each one building on the last.
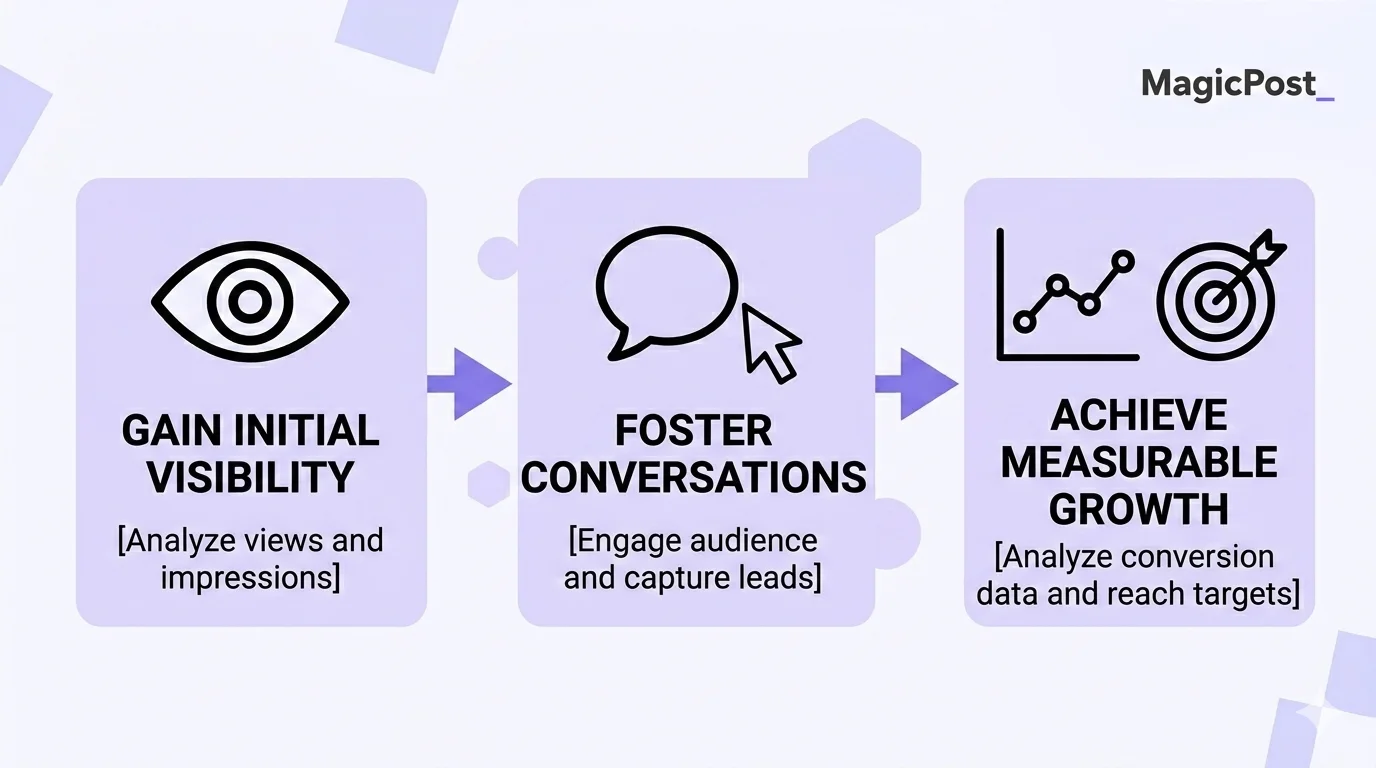
Visibility tells you if people are seeing your content. Engagement quality tells you if they’re reacting to it. Business impact tells you if any of it translates into something real.
Pillar | What It Answers | Key Metrics |
|---|---|---|
Visibility | Are people seeing my content? | Impressions, reach, and follower growth rate |
Engagement Quality | Are people genuinely reacting? | Comments (depth matters), saves, shares, and engagement rate |
Business Impact | Is it moving the needle? | Profile visits, website traffic, inbound DMs, and leads |
1. Visibility: Are You Even Being Seen?
Visibility metrics tell you how far your content is traveling. The main ones to watch are:
Impressions: the total times your post appeared in feeds.
Reach: the number of unique accounts that saw it.
Follower growth rate: whether your content is attracting new people over time.
A sudden drop in impressions is usually your earliest warning signal that something has shifted in your posting strategy, consistency, or how the algorithm is weighing your content. These are worth checking weekly.
For context on what drives impressions and how to improve them, see How to Increase Impressions on LinkedIn.
2. Engagement Quality: Are People Actually Caring?
Not all engagement is equal. LinkedIn’s algorithm weights interactions differently:
💬 Comments (especially 10+ words) carry the most algorithmic weight.
🔄 Shares signal that your content was worth amplifying.
🔖 Saves indicate genuine value.
👍 Likes are the weakest signal, but still count.
Your engagement rate is the headline number here. This is the formula for calculating is: ( Reactions + Comments + Shares + Clicks ) ÷ Impressions × 100
According to SocialInsider’s 2025 LinkedIn Benchmarks (based on 1 million posts), the platform average sits at 5.2% in 2025. Anything above that means your content is resonating above average.
Pro Tip: MagicPost’s free LinkedIn Engagement Rate Calculator does the math for you instantly.
3. Business Impact: Is This Doing Anything for You?
This is the pillar most creators have zero visibility on and the one that actually justifies the time investment. Business impact metrics track what happens after someone engages with your content:
Profile visits after posting: a spike here means your post made people curious enough to check you out.
Website referral traffic: Track LinkedIn as a source in your analytics, or add UTM parameters to any links you share.
Inbound DMs or connection requests from your target audience: The most direct signal that your content is working.
These metrics won’t appear in LinkedIn’s native analytics dashboard. You’ll need to cross-reference with your website analytics and pay attention to the quality of who’s reaching out. It takes extra effort, but it’s the difference between knowing your content looks good and knowing it’s actually working.
What Is Engagement Velocity and Why Does It Matter?
Engagement velocity is how quickly your post gains meaningful interactions in the minutes and hours after publishing. It’s the single most predictive metric for how far your content will travel because LinkedIn’s algorithm uses early engagement as the signal to decide whether to show your post to a wider audience.
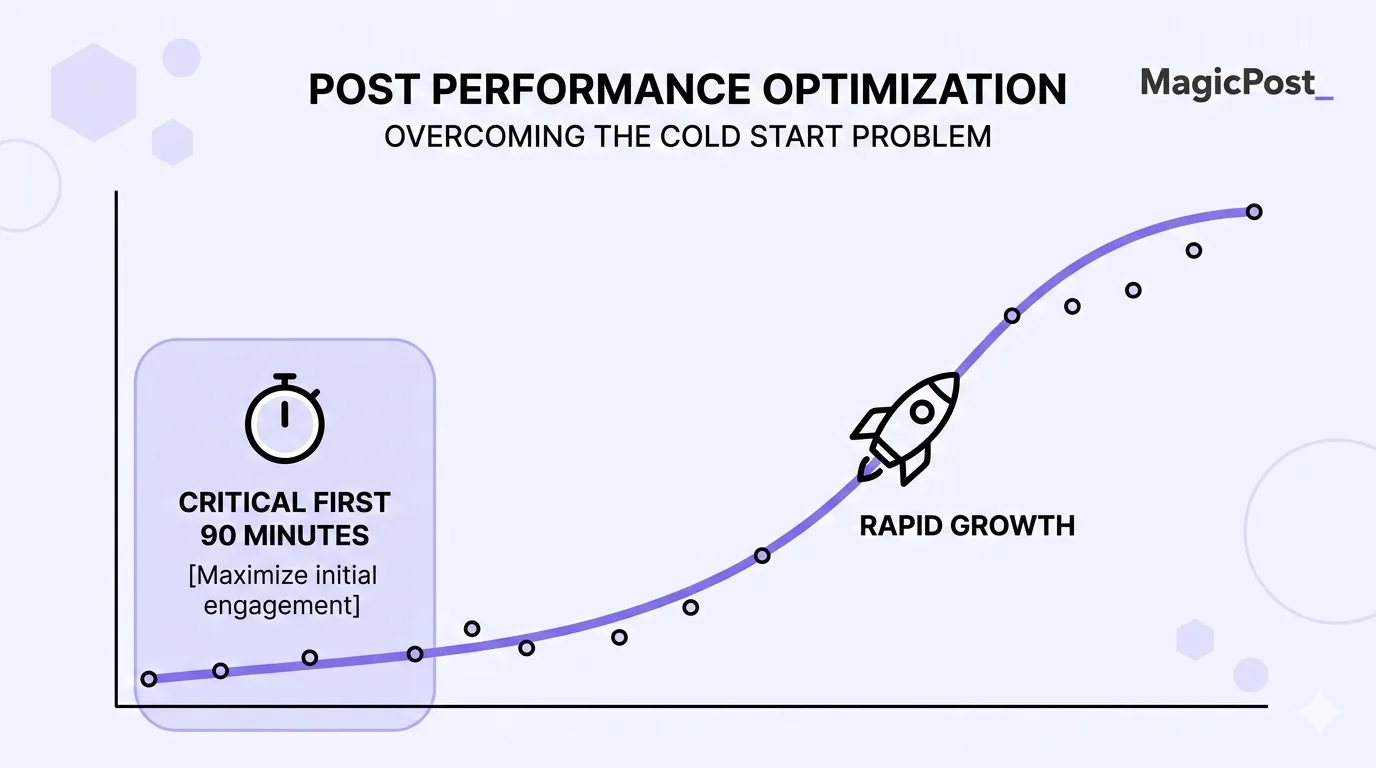
The window that matters most is the first 60 to 90 minutes, as posts that attract strong early engagement get significantly extended distribution, while posts that don’t gain traction early are unlikely to recover.
What this means practically:
Post when your audience is most active (check your own analytics, not just generic advice).
Reply to early comments quickly; your own responses count as engagement.
If a post underperforms in the first hour, treat it as useful data: the topic, hook, or format didn’t land. Adjust for next time.
MagicPost’s scheduling feature helps you hit your best posting windows automatically. For guidance on timing, check out the Best Time to Post on LinkedIn guide.
How to Track LinkedIn Content Performance
You don’t need a data science degree or an expensive tool. Here are three sources that together give you a complete picture. Use all three:
Step 1: Start with LinkedIn Native Analytics
Go to your LinkedIn profile and click “Analytics” under any post. You’ll see impressions, engagement breakdowns, and follower data.
Importantly, LinkedIn also shows you who is viewing your content by job title, industry, and location, which is more useful than most people realize. If the wrong audience is engaging, that’s worth knowing.
LinkedIn’s official guide: Understanding LinkedIn Analytics.
Step 2: Use MagicPost Analytics for the Full Picture
MagicPost’s built-in analytics dashboard pulls together your best posting times, top content formats, average engagement rates, and posting rhythm in one place. You don’t need to manually export data or use spreadsheets.
The most useful view is your top posts by engagement. Look at what they have in common and their format, topic, hook style, and length. That pattern is your template for what to produce more of.
Step 3: Add UTM Parameters for Web Traffic Attribution
If you share links to your website in posts or in your profile, add UTM parameters so your web analytics can attribute that traffic back to LinkedIn.
Generate them with Google’s Campaign URL Builder, add them to your links, and you’ll have a clear data on whether LinkedIn is actually sending people to your site and what they do when they get there.
What Does Good LinkedIn Content Performance Look Like?
Benchmarks give you a reference point, but your own historical data is always more useful than industry averages.
Here’s where the numbers sit in 2025,based on SocialInsider’s analysis and Metricool’s LinkedIn Statistics:
Metric | Average | Good | Strong |
|---|---|---|---|
Engagement rate (by impressions) | ~3.85% | 5 to 6% | 7%+ |
Comments per post | ~4 | 10 to 15 | 20+ |
Shares per post | Low | 3 to 5 | 10+ |
Profile visit spike after posting | Baseline | 2 to 3x | 5x+ |
Follower growth rate (monthly) | Less than 0.5% | 1 to 2% | 3%+ |
One important nuance: personal profiles consistently outperform company pages on LinkedIn. Plus, within personal profiles, creators who post consistently about a specific topic tend to see higher engagement rates over time, as LinkedIn’s algorithm recognizes their topical authority.
How Do You Use Content Data to Improve on LinkedIn?
Data is only useful if it changes what you do next. Here’s a simple process:
Look at your top 3 performing posts from the last 30 days.
Identify what they share: same format? Similar topic? Strong hook? Specific length?
Look at your bottom 3. What’s different?
Adjust one variable at a time: format, hook style, posting time, or topic.
Track the next 2 to 3 posts with the same lens.
MagicPost’s analytics make this straightforward. Your best posting types, top content types, and engagement by format are all visible in one dashboard, without exporting anything.
For more on building a consistent system, check out LinkedIn Posting Strategy, Best Frequency to Post on LinkedIn, and How to Create Engaging Content on LinkedIn.
Start Tracking What Actually Matters
Measuring content performance doesn’t have to mean becoming a data analyst. Pick the right three pillars, check them consistently, and use what you find to make each round of posts a little sharper than the last.
MagicPost gives you the analytics built in, alongside the writing and scheduling tools to act on what you learn. Spend less time staring at spreadsheets and more time creating content that actually moves people.
Try MagicPost for free, no credit card required. Start your free trial and see your LinkedIn performance in a whole new light.
Veelgestelde vragen
What is content performance?
Content performance measures how well your posts achieve a specific goal, whether that's reach, engagement, or business outcomes like leads and profile visits. It's not one number but a combination of signals that together tell you whether your content strategy is working.
What is a good LinkedIn engagement rate in 2025?
According to SocialInsider's 2025 benchmark data, the average LinkedIn engagement rate by impressions is 5.2% in 2025. Anything above that is performing above average. B2B tech averages around 3.6%, professional services around 3.2%, so industry context matters when benchmarking.
What's the difference between impressions and reach on LinkedIn?
Impressions count the total number of times your post was shown in a feed, including multiple views by the same person. Reach counts the number of unique accounts that saw it. Reach is the more meaningful figure for understanding how far your content actually traveled.
How often should I review my content performance?
A quick weekly check is enough for most creators: look at engagement velocity on recent posts and flag anything that significantly over- or underperformed. A deeper monthly review, comparing your top and bottom posts, noting patterns, and adjusting your approach, is where the real improvements happen.
Why do I get engagement but no leads?
High engagement with no leads usually means one of two things: you're reaching the wrong audience (check the demographics in LinkedIn's analytics), or your content isn't connecting back to what you do.
LinkedIn's algorithm research shows it prioritizes content that leads to real professional outcomes, which means your posts need a clear perspective and a reason for the right people to care, not just broad appeal.
Can MagicPost track my LinkedIn analytics?
Yes. MagicPost includes built-in LinkedIn analytics that show your best posting times, top content formats, average engagement rates, and posting rhythm, all without leaving the platform.
It's designed to give you the performance overview you need to improve without the dashboard overload. Learn more at MagicPost.in.