" height="26.80529977783203px" id="tymKb8bqC" width="128.00300311279295px"/><path d="M 0 2.417 L 0 0 L 12.909 0 L 12.909 2.417 Z" fill="rgb(126, 78, 253)" height="2.417099999999998px" id="aYr4em6zK" transform="translate(128.341 22.325)" width="12.908999999999992px"/></svg>)
"/><stop offset="1" stop-color="rgb(118, 37, 250)"/></linearGradient></defs><g d="M 19.242 21.22 L 19.362 6.204 L 19.272 6.204 L 13.757 21.22 L 10.161 21.22 L 4.796 6.204 L 4.706 6.204 L 4.825 21.22 L 0 21.22 L 0 0 L 7.283 0 L 12.109 13.607 L 12.229 13.607 L 16.844 0 L 24.247 0 L 24.247 21.22 Z M 26.421 26.113 L 26.421 23.445 L 41.407 23.445 L 41.407 26.113 Z" fill="transparent" height="26.112508199679183px" id="DvfaAIHYn" width="41.40731898311435px"><path d="M 19.242 21.22 L 19.362 6.204 L 19.272 6.204 L 13.757 21.22 L 10.161 21.22 L 4.796 6.204 L 4.706 6.204 L 4.825 21.22 L 0 21.22 L 0 0 L 7.283 0 L 12.109 13.607 L 12.229 13.607 L 16.844 0 L 24.247 0 L 24.247 21.22 Z" fill="rgb(46, 46, 46)" height="21.220180016149442px" id="pLsxRCobd" width="24.247352589074694px"/><path d="M 0 2.668 L 0 0 L 14.986 0 L 14.986 2.668 Z" fill="url(%23yD9d4I5GR-3279285344-linear-gradient)" height="2.6675085048549647px" id="yD9d4I5GR" transform="translate(26.421 23.445)" width="14.986002836263765px"/></g></svg>)

Saad Mouaouine
LinkedIn analytics can feel like a lot at first. You post something, click the little chart icon underneath, and suddenly you’re looking at impressions, members reached, engagement rate, and a handful of other numbers that don’t come with much explanation.
This LinkedIn analytics guide breaks down every metric that matters in plain English. Here’s what each one measures, where to find it, what a good number looks like in 2026, and what to do if yours is lower than you’d like.
Short Answer: The only LinkedIn analytics metrics you should be looking at are the following:
Post analytics: Impressions, members reached, engagement rate, reactions breakdown, quick-through rate, post reach vs. impressions, and top-performing posts.
Profile and audience analytics: Profile views, search appearances, follower analytics, and audience demographics.
Growth metrics: Follower growth and LinkedIn growth tracking.
How to Access Your LinkedIn Analytics
LinkedIn puts analytics in a few different places depending on what you want to see.
Post analytics: Click the blue “view analytics” or the number of impressions at the bottom of any post you published. This shows data for that specific post.
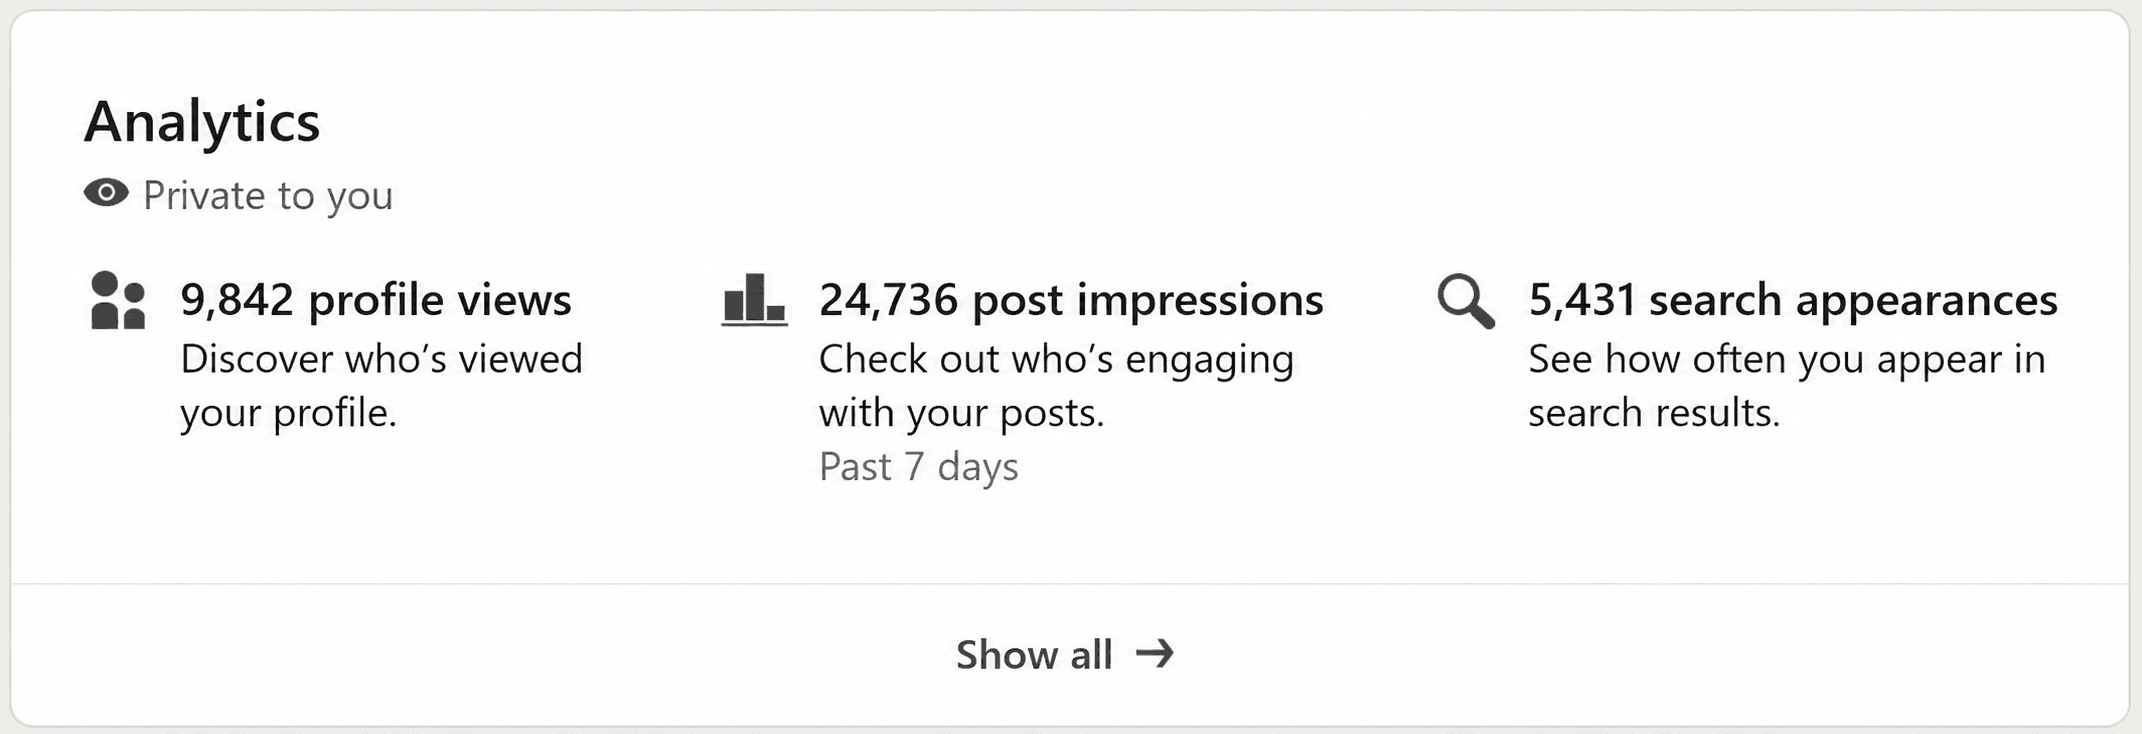
Overall dashboard: Go to your profile, scroll to the “Analytics” section, and click any of the three tiles (profile views, post impressions, or search appearances). This opens your full analytics dashboard.
Audience analytics: From your profile, scroll to the “Analytics” section, click any of the three tiles (or “show all”), then click “Followers.”
One important limitation to know upfront is that LinkedIn only stores your data for the past 12 months. After that, it disappears from the dashboard. If you want a longer historical record, you need to export it regularly or use a third-party analytics tool.


These are the numbers attached to individual posts. They tell you how far each piece of content traveled and how people responded to it.
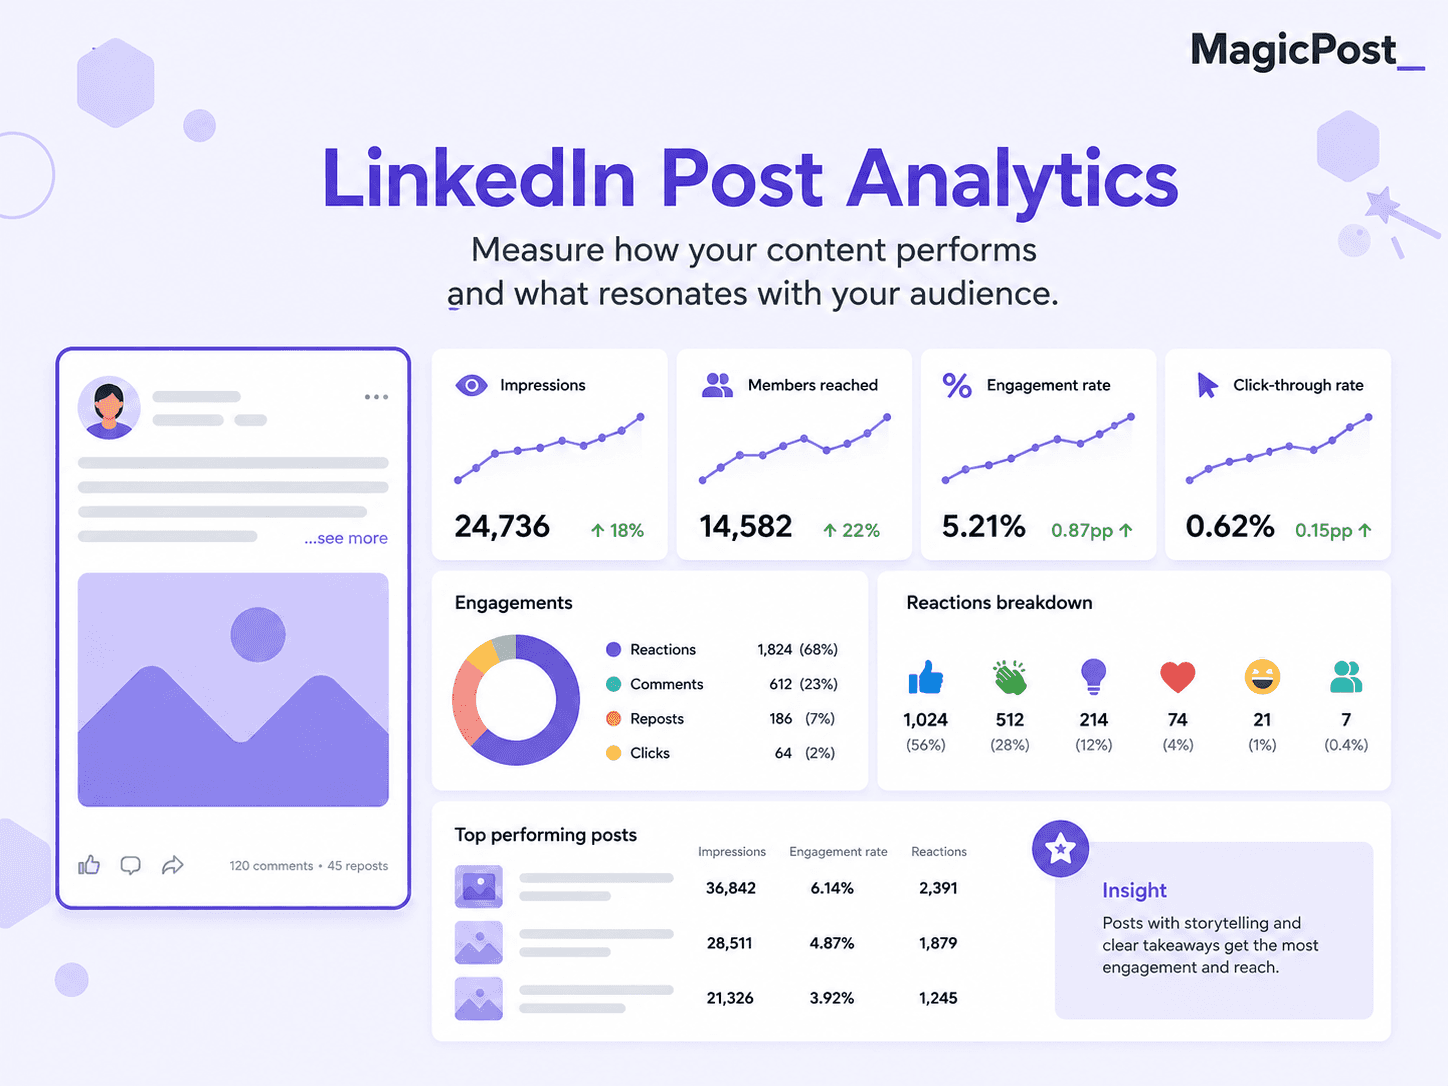
Impressions
“Impressions” are the total number of times your post appeared in someone's LinkedIn feed. One person scrolling past twice counts as two impressions.
LinkedIn records an impression when at least 50% of your post is visible on screen for a minimum of 300 milliseconds, which is roughly the amount of time it takes to scroll past without stopping.
This means impressions are a reasonable approximation of how many times your post was seen, but not a precise count of how many people actually read it. Someone scrolling quickly through their feed at the right moment will generate an impression without engaging.
📊 What counts as a good number of impressions? Based on AuthoredUp’s analysis of over 3 million posts, the median impression count for personal profiles sits around 860 per post. Under 500 usually points to a weak hook, poor timing, or the algorithm not distributing the content widely. Impressions alone don’t tell the full story, so always read them alongside engagement rate.
✅ For a deeper breakdown of how impressions differ from views and from members reached, see our guide to LinkedIn impressions vs. views.
Members Reached
“Members reached” is the number of unique people who saw your post. While impressions count every time your post appears in a feed (including repeat views from the same person), members reached counts each person only once.
The gap between impressions and members reached is telling you something useful. If a post has 3,000 impressions and 1,800 members reached, that means some people came back to it multiple times, which is a positive signal. People re-reading a post, sharing it, or returning to check the comments all contribute to that gap.
📌 Impressions counts every feed appearance, but members reached counts unique people. Both numbers matter, but members reached is the cleaner measure of how far your post actually traveled.
Engagement Rate
Engagement rate is the percentage of people who did something after seeing your post. LinkedIn counts the following as engagement:
Reactions (likes, celebrates, loves, insightful, etc.)
Comments
Reposts
Clicks (including clicking "see more,” clicking a link, or clicking your name)
Passive activity like hovering or pausing does not count. The standard formula is straightforward:
Engagement Rate = (Reactions + Comments + Reposts + Clicks) / Impressions x 100
Some people calculate it against followers instead of impressions. Both approaches work, but impressions-based calculations are more accurate because LinkedIn only shows your post to a fraction of your followers, typically around 5% to 15% initially.
Follower-based rate underreports strong content and overreports weak content.
Engagement Rate | What It Means |
|---|---|
Below 2% | Below average. Content may be too generic or the hook isn't connecting. |
2% to 4% | Average for personal profiles in 2026. |
4% to 6% | Good. Above the platform average of 3.85%. |
6% to 10% | Excellent. Your content is resonating clearly. |
Above 10% | Exceptional. Typically means the post hit a very specific nerve with your audience. |

📊 As of 2026, the average LinkedIn engagement rate for personal profiles is around 3.85%, up from 3.2% in 2024. Company pages average 2.1%, which is significantly lower because the algorithm prioritizes human-to-human content over brand broadcasts.
Reactions Breakdown
LinkedIn offers six reaction types: Like, Celebrate, Support, Love, Insightful, and Funny.
In your post analytics, you can see the breakdown of which reaction type your post received most. This matters more than it might seem, as the type of reaction your content attracts is a signal of how people interpreted it.
A post getting mostly “Insightful” ****reactions tells you something different than one getting mostly “Celebrates.”
It also hints at whether the content landed as informative, motivational, empathetic, or entertaining, which can inform how you write future posts on similar topics.
From an algorithm perspective, all reaction types carry roughly equal weight in engagement calculations.
Comments and reposts tend to signal stronger engagement quality than reactions alone, but reactions are still counted.
Post Reach vs. Impressions
You’ll see both terms used across LinkedIn’s own interface and third-party tools, and they’re often confused with each other. There actually is a difference between post reach and impressions.
Term | What It Measures | Counts Repeats? |
|---|---|---|
Impressions | Total times post appeared in a feed | ✅ |
Members Reached | Unique people who saw the post | ❌ |
Reach (third-party) | Often used interchangeably with Members Reached | ❌ |
The confusion happens because different tools use different terminology. LinkedIn's native dashboard uses "members reached" for unique viewers. Third-party analytics tools sometimes label this as "reach." The underlying data is the same.
Click-Through Rate
“Click-through rate” measures the percentage of people who clicked on a link in your post or on your post itself (including clicking "see more" to expand the text). The formula is simple:
Clicks/Impressions x 100
LinkedIn's native analytics do show click data, but it's bundled into total engagements rather than broken out separately in most views. To see precise click counts, you usually need a third-party analytics tool or LinkedIn's Campaign Manager for paid content.
📊 Sponsored content averages 0.44% to 0.65% CTR. Message Ads average around 3.2% due to direct inbox delivery. For organic posts, click data is less consistently reported, but posts with a clear single call-to-action and a link tend to see higher click rates than posts with multiple competing actions.
Top Performing Posts
LinkedIn shows you your top-performing posts inside the Analytics dashboard under Content. Posts are ranked by impressions by default, but you can sort by engagement, reactions, comments, or reposts to surface different patterns.
Looking at your top posts regularly is useful. You're not just looking for what got the most impressions. You're looking for patterns: which topics, which formats, which opening lines, which posting days consistently outperform the rest. That's where your actual content strategy should come from, your own data rather than general advice.
✅ For a full breakdown of what drives post performance, see our guide to how to measure content performance on LinkedIn.
LinkedIn Profile and Audience Analytics
While post analytics tell you how your content performs, these metrics tell you who you're actually reaching and whether it's the right people.
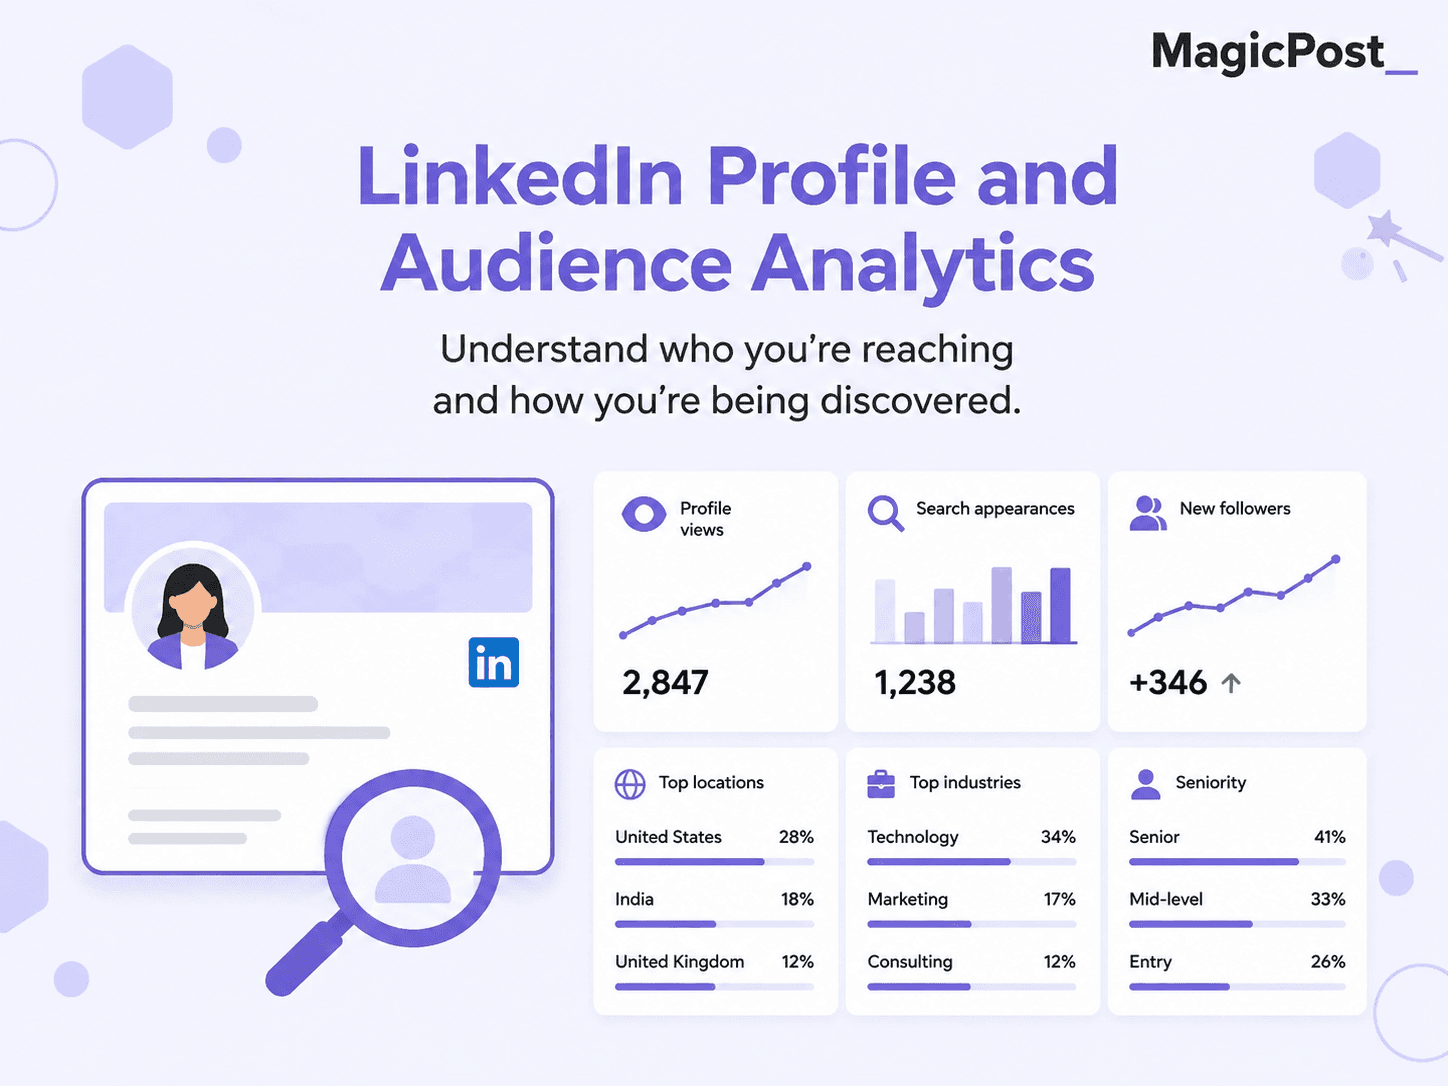
Profile Views
“Profile views” tells you how many times your LinkedIn profile was visited within a given time period.
Free accounts see the five most recent viewers from the past 90 days.
LinkedIn Premium accounts see the full list for up to 365 days, with filters by date range, company, industry, and viewer type.
A sudden increase in profile views often follows a post that performed well, a new comment you left on a high-visibility post, or a mention from someone with a large audience.
Tracking profile views alongside post activity helps you understand which content actions are converting to profile visits.
✅ For a full breakdown of the difference between free and Premium profile view data, see our guide to who viewed your LinkedIn profile.
Search Appearances
“Search appearances” shows how many times your profile appeared in LinkedIn search results during a given week. It also tells you which companies and job titles the people who searched for you work in, and which keywords they used to find you.
This metric is documented directly by LinkedIn in their Help Center: View your profile Search Appearances. It's a measure of discoverability rather than engagement.
A high search appearance count means your profile is surfacing when people search for your skills, job title, or industry.
A low count usually means your headline, about section, or skills list doesn't contain the keywords your target audience is actually searching for.
📌 The easiest way to improve this is via your headline (LinkedIn’s algorithm weighs this heavily), your “About” section, and your skills list. Use the exact job titles and skill terms that people in your target audience actually search for, not the internal language your company uses. Posting consistently also boosts search appearances, as active profiles are ranked higher in LinkedIn’s search results.
Follower Analytics
Follower analytics give you a time-series view of how your follower count is changing day by day, alongside demographic information about who your followers are.
According to LinkedIn's own documentation, you can filter follower data by the past 7 days up to the past 365 days and export it to a spreadsheet. You can also see new follower growth trends separately from your total follower count.
The follower growth graph is more useful than the total follower count for understanding momentum:
A flat line at a high number means your growth has stalled.
A rising line at a lower number means your content strategy is working.
✅ For more on how follower growth relates to content strategy, see our guide to how to get more LinkedIn followers.
Audience Demographics
Audience demographics breaks down who your followers are across six categories. This data is available to all LinkedIn members in their “Analytics and tools” section.
Demographic Filter | What It Shows |
|---|---|
Job title | The specific roles of your followers |
Location | Countries and cities your followers are based in |
Industry | Which industries your followers work in |
Seniority | Career level: individual contributors, managers, directors, VPs, executives |
Company size | Whether followers work in small businesses, mid-market, or enterprise companies |
Company | Which specific companies your followers work for |
This is some of the most strategically useful data LinkedIn offers:
If you're trying to reach VP-level decision-makers in SaaS companies and your demographics show you're mostly reaching entry-level marketers, you know your content or positioning needs to shift.
If your target audience is already following you, you know you're on the right track.
⚠️ One important caveat: demographic data for personal profiles shows your top five results per category, not the full breakdown. Company pages get more granular data. Demographics also don't update based on the reporting date range you select for growth trends.
LinkedIn Growth Metrics
This is where you zoom out. Instead of looking at individual posts, you're looking at whether your LinkedIn presence is actually building over time.
How to Track LinkedIn Growth
LinkedIn's native analytics give you a 12-month rolling window. That's enough to spot short-term trends, but it doesn't give you a long-term view of whether your LinkedIn presence is actually compounding over time.
Here are a few practical approaches that work:
Export your analytics to a spreadsheet at the end of each month. LinkedIn lets you export follower data as an XLSX file from the follower analytics tab. Even a simple record of total followers, monthly impressions, and average engagement rate gives you meaningful trend data after three to six months.
Track your top posts monthly. Pull the five posts with the highest engagement each month and note the format, topic, and hook. After a few months, patterns will emerge that are specific to your audience rather than general advice.
Use the search appearances trend to monitor profile discoverability. A sustained drop in search appearances usually means you've gone quieter on the platform or your keywords have become misaligned with how people are searching in your space.
⚠️ The 12-month data limit is a serious bottleneck. LinkedIn deletes analytics older than one year. If you want a longer historical record, you need to either export manually each month or use a third-party LinkedIn analytics tool that stores your data externally. Tools like MagicPost and AuthoredUp keep your historical data beyond LinkedIn’s rolling window.
LinkedIn Post Reach vs. Follower Count
One of the most counterintuitive things about LinkedIn analytics is that your post reach often has very little to do with your follower count.
LinkedIn's algorithm initially shows your post to a small subset of your followers, typically around 5% to 15%, and then widens distribution based on early engagement signals. A post with strong early engagement reaches people who don't follow you at all through their connections' activity.
This is why a creator with 2,000 followers and an 8% engagement rate can generate more total interactions than someone with 50,000 followers and a 0.5% engagement rate.
2,000 followers times 10% reach (200 impressions) times 8% engagement gives you 16 engagements.
50,000 followers times 10% reach (5,000 impressions) times 0.5% engagement gives you 25 engagements.
The gap is smaller than the follower count implies and closes completely once early engagement triggers broader distribution.
✅ For more on how impressions translate to actual reach, see our guide to what counts as good impressions on LinkedIn.
Want Deeper Analytics Than LinkedIn’s Native Dashboard?
MagicPost tracks impressions, engagement, audience demographics, posting time trends, and competitor benchmarks beyond LinkedIn’s 12-month window. The Analytics plan starts at $35/mo. with a free trial, and you don’t need a credit card to try it out.
FAQ
What is a good LinkedIn engagement rate in 2026?
The platform average for personal profiles in 2026 is around 3.85%. A rate of 4% to 6% is considered good, above 6% is excellent, and above 10% is exceptional.
Company pages average around 2.1% because the algorithm prioritizes content from individuals over brand pages. Engagement rate varies significantly by content format: carousels and document posts consistently outperform text-only posts.
What is the difference between LinkedIn impressions and members reached?
“Impressions” counts the total number of times your post appeared in a LinkedIn feed, including multiple appearances for the same person. Members reached counts unique individuals only.
If a post has 3,000 impressions and 1,500 members reached, that means each person saw it an average of twice. Both numbers are visible in your post analytics by clicking the chart icon under any post you authored.
Where do I find my LinkedIn search appearances?
Go to your LinkedIn profile, scroll down to the “Analytics” section, and click “Search appearances.” You'll see the weekly count plus information about which companies and job titles the people who searched for you work in. This data is only visible to you and resets weekly.
How far back does LinkedIn analytics go?
LinkedIn stores analytics data for a rolling 12-month window. Data older than one year is removed from the dashboard. If you want longer historical records, export your analytics to a spreadsheet monthly using the export button in the follower analytics section, or use a third-party tool that stores your data externally.
Why does my engagement rate vary so much between posts?
Several factors affect individual post engagement: the strength of your opening line (hook), the topic and how closely it matches what your audience cares about, the posting time relative to when your audience is most active, the content format (carousels and document posts consistently outperform text-only), and whether you engage with early comments in the first hour after posting.
Early engagement signals tell LinkedIn's algorithm whether to distribute the post more widely.
What is LinkedIn members reached and why is it different from impressions?
“Members reached” is the unique person count for your post, while impressions includes repeat views from the same person. LinkedIn displays members reached in your overall analytics dashboard and impressions in individual post analytics.
The gap between the two isn’t a problem. A higher ratio of impressions to members reached usually means people are returning to your post, which is a positive engagement signal.
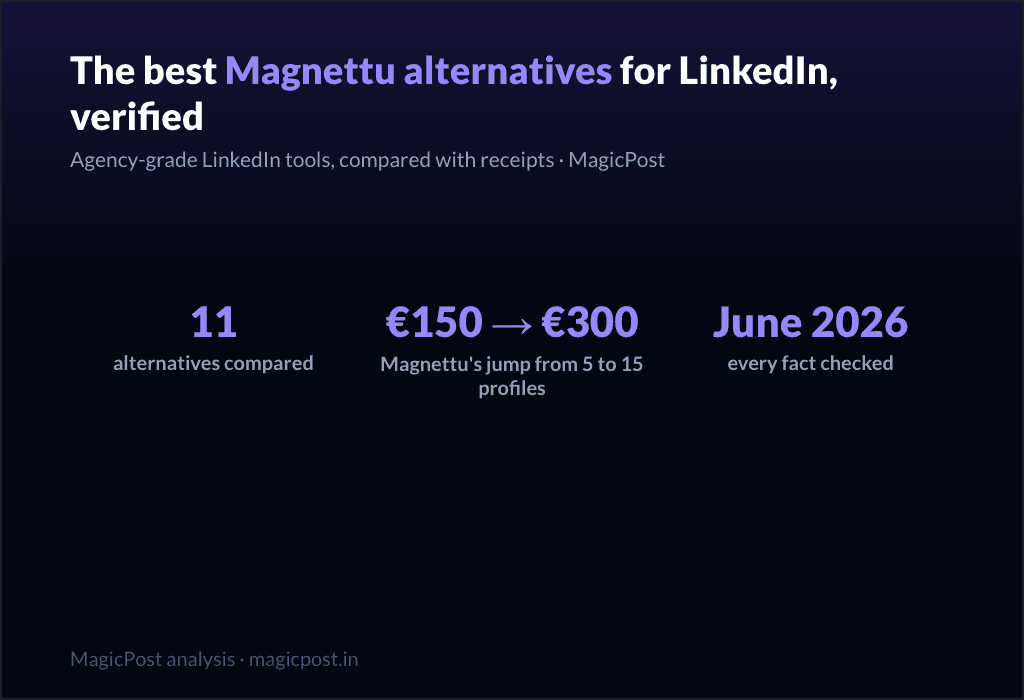
11 Best Magnettu Alternatives for LinkedIn (Verified June 2026)
Magnettu pitches agencies "your clients' LinkedIn, finally under control", with per-profile tiers from EUR29.95 to EUR300/mo. 11 agency-grade alternatives compared with receipts, June 2026.
11 Best Kawaak Alternatives for LinkedIn (Verified June 2026)
Kawaak is becoming a B2B influence platform; its pricing page is a 404 and its own users flag generic AI. 11 content-tool alternatives compared with receipts, June 2026.
11 Best SocialSonic Alternatives for LinkedIn (Verified June 2026)
SocialSonic packs the widest budget surface, with "Coming Soon" on several features and an undocumented publishing path. 11 alternatives compared with receipts: voice AI, benchmarks, shipped features, June 2026.

9 Best Sociabble Alternatives for LinkedIn Advocacy (Verified June 2026)
Sociabble is excellent and heavy: 4 modules, ~3-month rollouts, custom pricing. 9 lighter ways to turn employees into LinkedIn voices, compared with receipts, June 2026.
11 Best Swello Alternatives for LinkedIn (Verified June 2026)
Swello is the best-loved generalist we have reviewed, and still a generalist on LinkedIn: caption AI, cross-network analytics, no documented mentions. 11 alternatives compared with receipts, June 2026.

11 Best Metricool Alternatives for LinkedIn (Verified June 2026)
Metricool's free plan covers every network except LinkedIn, its own pricing page says so. 11 LinkedIn alternatives compared with receipts: mentions, voice AI, real LinkedIn benchmarks, June 2026.

11 Best Buffer Alternatives for LinkedIn (Verified June 2026)
Buffer is the friendliest generalist, and its own reviewer says it best: it lacks the platform's native depth. 11 LinkedIn alternatives compared with receipts: mentions, voice AI, benchmarks, June 2026.