The best LinkedIn analytics tools are the ones that add something LinkedIn does not already show you. Since Shield shut down, and with post analytics available to verified applications through LinkedIn's official API, the market split in two.
On one side, tools that reformat your native numbers. On the other, tools that put those numbers in context: a benchmark for your follower bracket, who actually follows you, which formats and days work for you, and exports you can hand to a client.
This guide compares 12 LinkedIn analytics tools on exactly that, with monthly prices and reference numbers to read your own metrics against.
Kliver Analytics ranks first for analytics alone: bracket benchmarks and a history kept beyond LinkedIn's window, at $19 per seat per month. MagicPost ranks second, the pick when the same tool also has to write, schedule, engage and capture leads.
LinkedIn analytics tools at a glance (2026)
Tool | Best for | Profiles / Pages | Data access | From $/mo. | Free option |
Analytics only: bracket benchmarks and a history kept beyond LinkedIn's window | Profiles | Official LinkedIn API, read-only, no extension | $19 per seat | No-card trial | |
Analytics alongside writing, scheduling, engagement and leads | Both | Official LinkedIn API, no extension | $49 | No-card trial | |
LinkedIn native analytics | The free baseline | Both | Native | $0 | Free for every member |
AuthoredUp | Post-by-post comparisons and CSV export | Both | Chrome extension (read-only, no cookies) | $19.95 | No-card trial |
Taplio | Metrics while you browse LinkedIn | Profiles | Chrome extension | $39 | 7-day trial |
Supergrow | Writing-first creators who need basic analytics | Profiles | Official API (vendor claim) | $39 | 7-day trial |
Vaizle | Free Company Page report | Pages | Page connection | $9 (introductory) | Free LinkedIn Page tools |
Buffer | Free basic post stats | Both | Official partner integration | $0 ($5 per channel) | Free plan, 3 channels |
SocialPilot | Budget reporting for many accounts | Both | Dashboard connection | $30 | 14-day trial |
Metricool | Multi-network dashboard for small teams | Both (paid plans) | Official partner integration | $25 | Free plan (LinkedIn excluded) |
Hootsuite | Enterprise suite with LinkedIn analytics | Both | Dashboard connection | $99 (billed annually) | 14-day trial |
Socialinsider | Competitor benchmarking for Company Pages | Pages | API and Looker Studio add-ons | $82 | 14-day trial |
Prices are the monthly billing figures from each vendor's pricing page. Hootsuite only publishes per-user prices billed annually; its monthly billing price is not public.
What a LinkedIn analytics tool should measure (and what LinkedIn already shows you)
LinkedIn's own analytics already give every member impressions, members reached, reactions, comments, reposts, saves, profile viewers per post, follower demographics, and an .XLSX export. A paid LinkedIn analytics tool that stops there is a nicer skin on free data.
The metrics that change decisions are the ones LinkedIn does not compute. Is 742 impressions good? Only against creators your size.
Are you reaching the job titles you sell to? Only an audience breakdown says so. And whether carousels beat text for you specifically takes a per-format table over time.
The table below shows what each of the 12 LinkedIn analytics tools really measures, from public documentation and pricing pages.
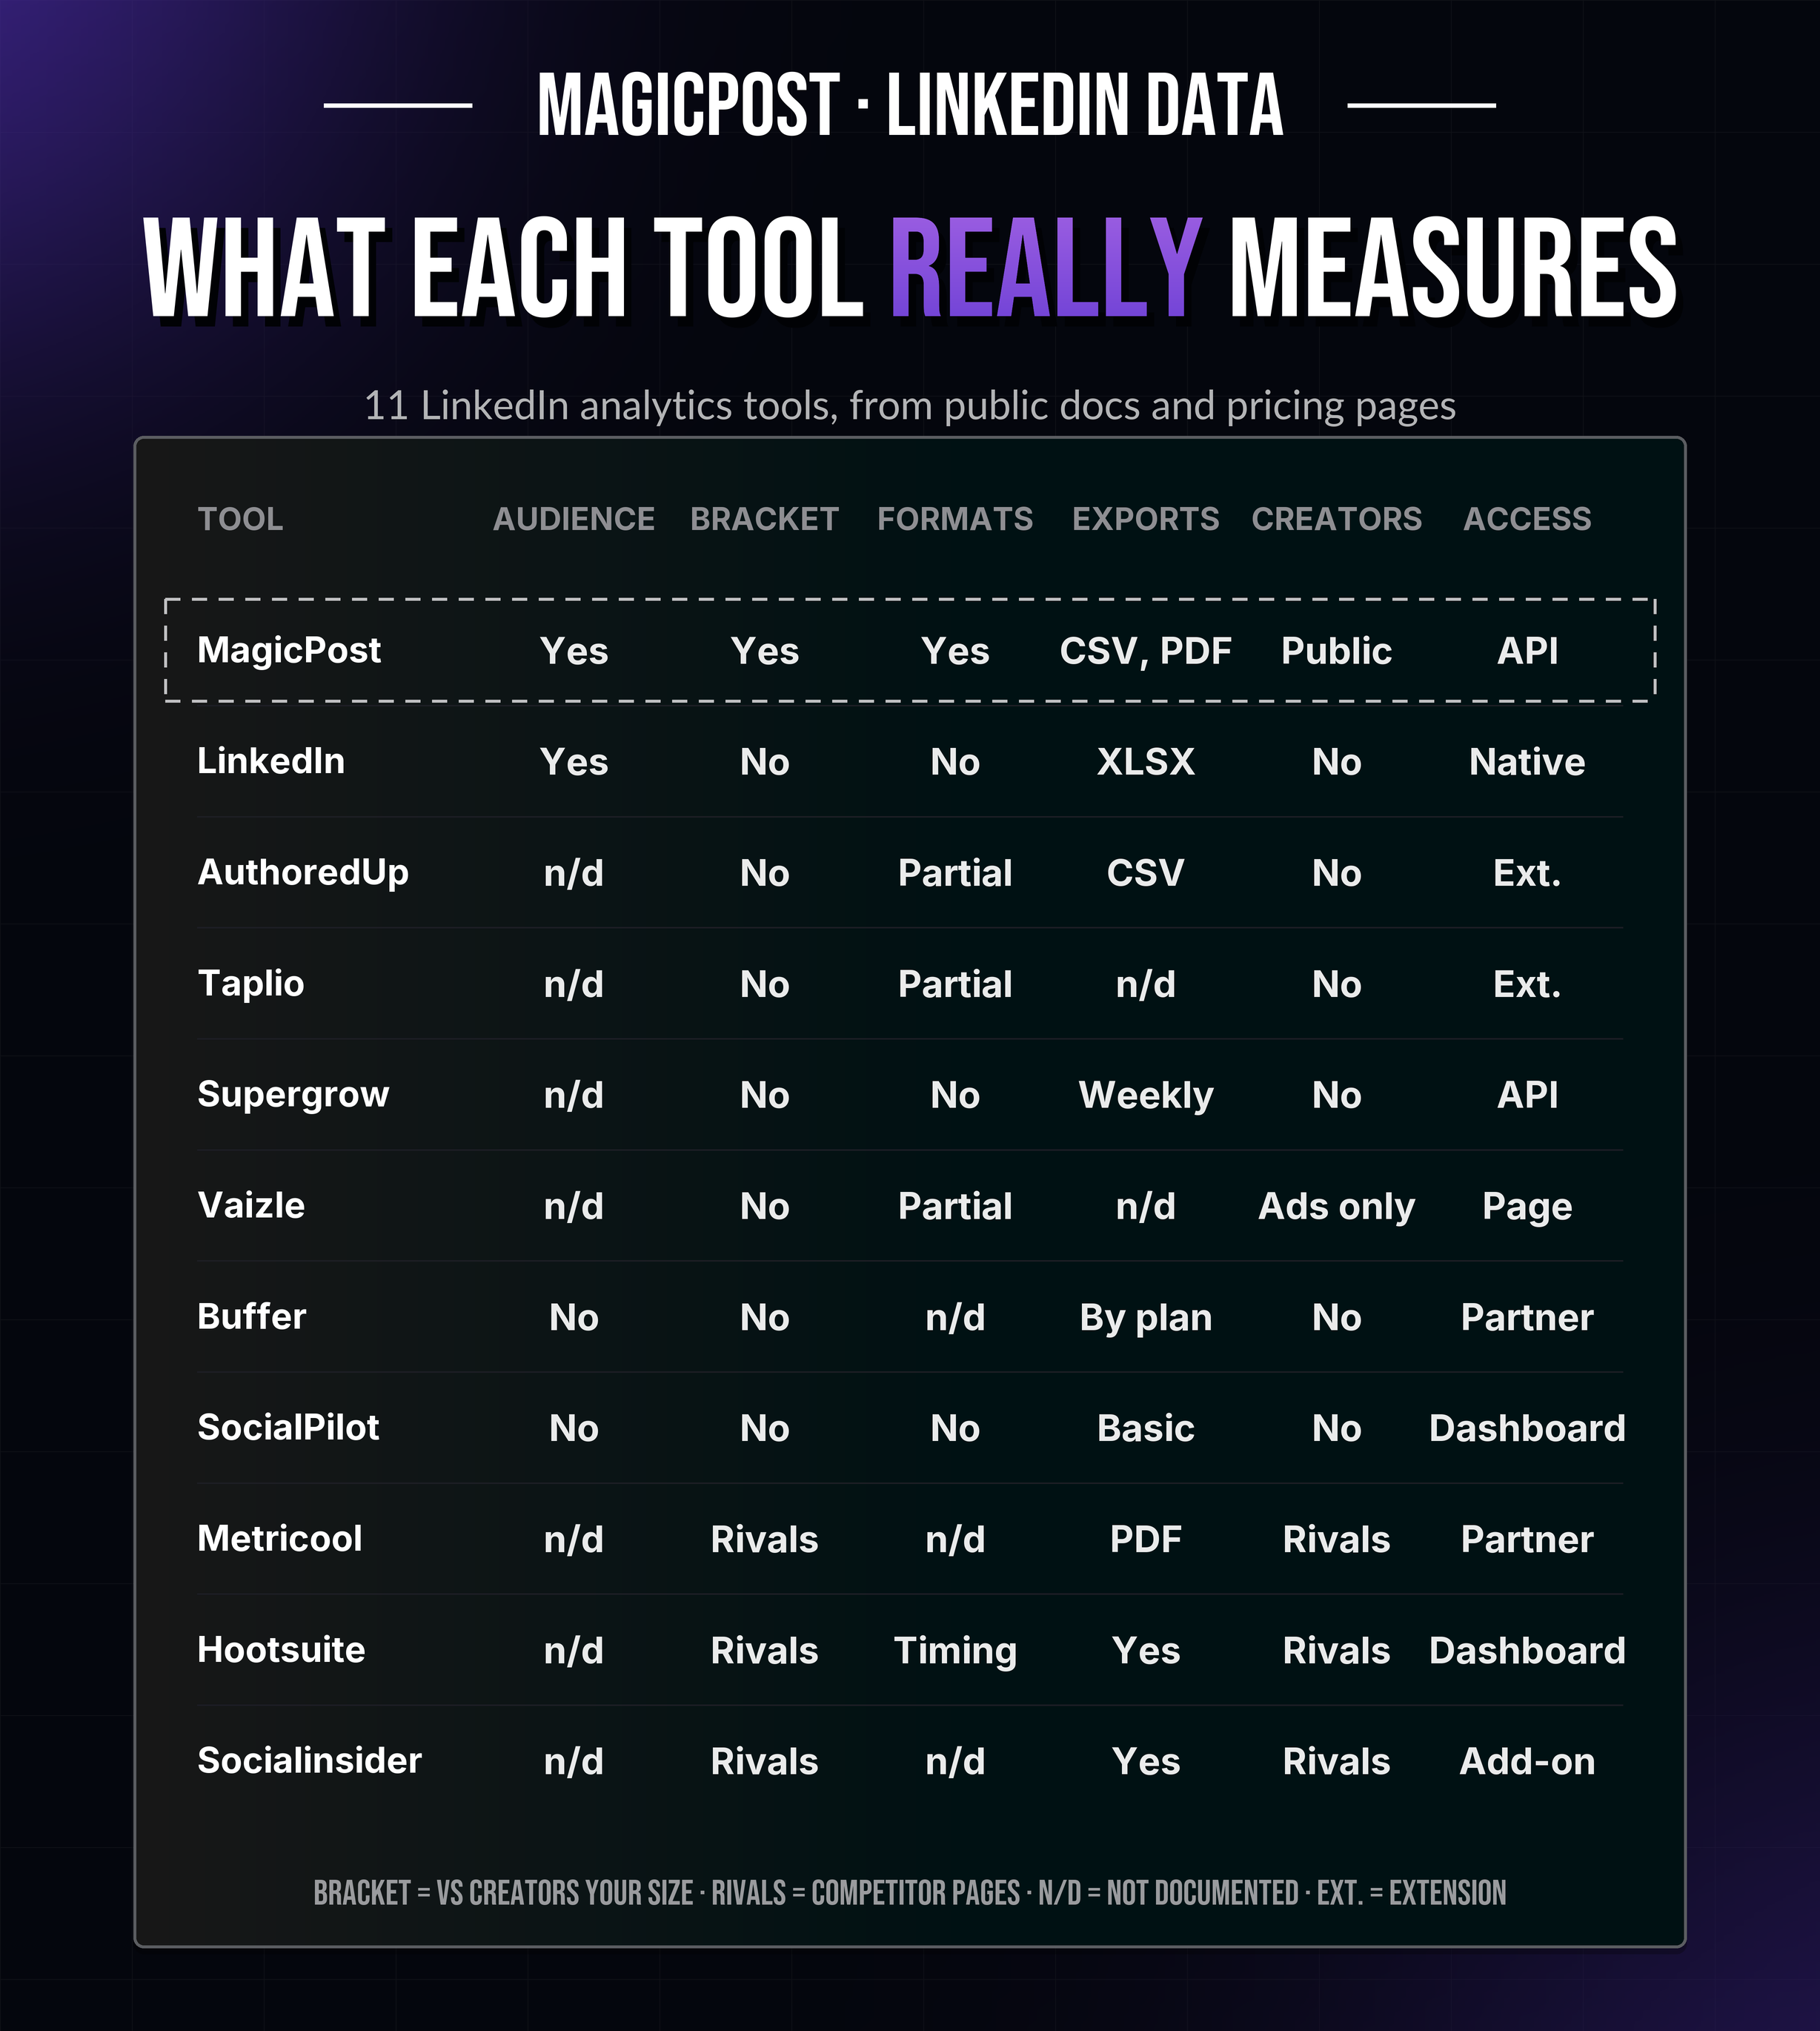
Tool | Profile / Page | Audience breakdown | Benchmark by follower bracket | Formats and timing | Post table and export | Shareable report | Other creators' metrics | Data access |
Kliver Analytics | Yes / Not documented | Yes, from your last 20 posts' engagers (country to seniority) | Yes, median and percentile in your bracket | Yes, format, length and weekday vs your bracket | Yes, sortable over the whole kept history | Report export | Any public profile, same yardstick | Official API, read-only |
MagicPost | Yes / Yes (fewer Page metrics) | Yes, 7 dimensions (country to account type) | Yes, per follower bracket | Yes, scored against your bracket | Yes, advanced columns; CSV | A4 PDF; white-label (Agency) | Any creator's public activity | Official API, OAuth |
LinkedIn native | Yes / Yes | Top five per demographic | No | No | Combined view, .XLSX export | No | No | Native |
AuthoredUp | Yes / Yes | Not documented | No | Historical filtering, word cloud | Yes (saves, sends); CSV | Not documented | No | Read-only extension |
Taplio | Yes / Not documented | Not documented | No | Top-performing posts over time | Not documented | Not documented | No | Extension |
Supergrow | Yes (Pro) / Not documented | Not documented | No | No | Weekly reports (Pro) | Weekly reports (Pro) | No | Official API (vendor claim) |
Vaizle | No / Yes | Not documented | No | 30-day trends | Not documented | Not documented | Competitor LinkedIn Ads only | Page connection |
Buffer | Yes / Yes | No | No | Not documented | Basic to advanced by plan | Branded reports (Team) | No | Official partner integration |
SocialPilot | Yes / Yes | No | No | No | Views, likes, comments, shares | Advanced Reports (higher tiers) | No | Dashboard connection |
Metricool | Yes (paid) / Yes | Not documented | Competitor analysis | Not documented | Yes | PDF and shared dashboards | Competitor analysis | Official partner integration |
Hootsuite | Yes / Yes | Not documented | Competitor benchmarking | Best Time to Publish | Yes, top-performer surfacing | Yes, reporting tags (Professional+) | Competitor benchmarking | Dashboard connection |
Socialinsider | No / Yes | Not documented | Competitor benchmarking (Pages) | Not documented | Yes, 3 to 12 months of history | Yes; Looker Studio add-on | Competitor Pages | API add-on |
Read the fourth column first. The benchmark by follower bracket is the single most useful number in LinkedIn analytics, because engagement is set by account size before anything else.
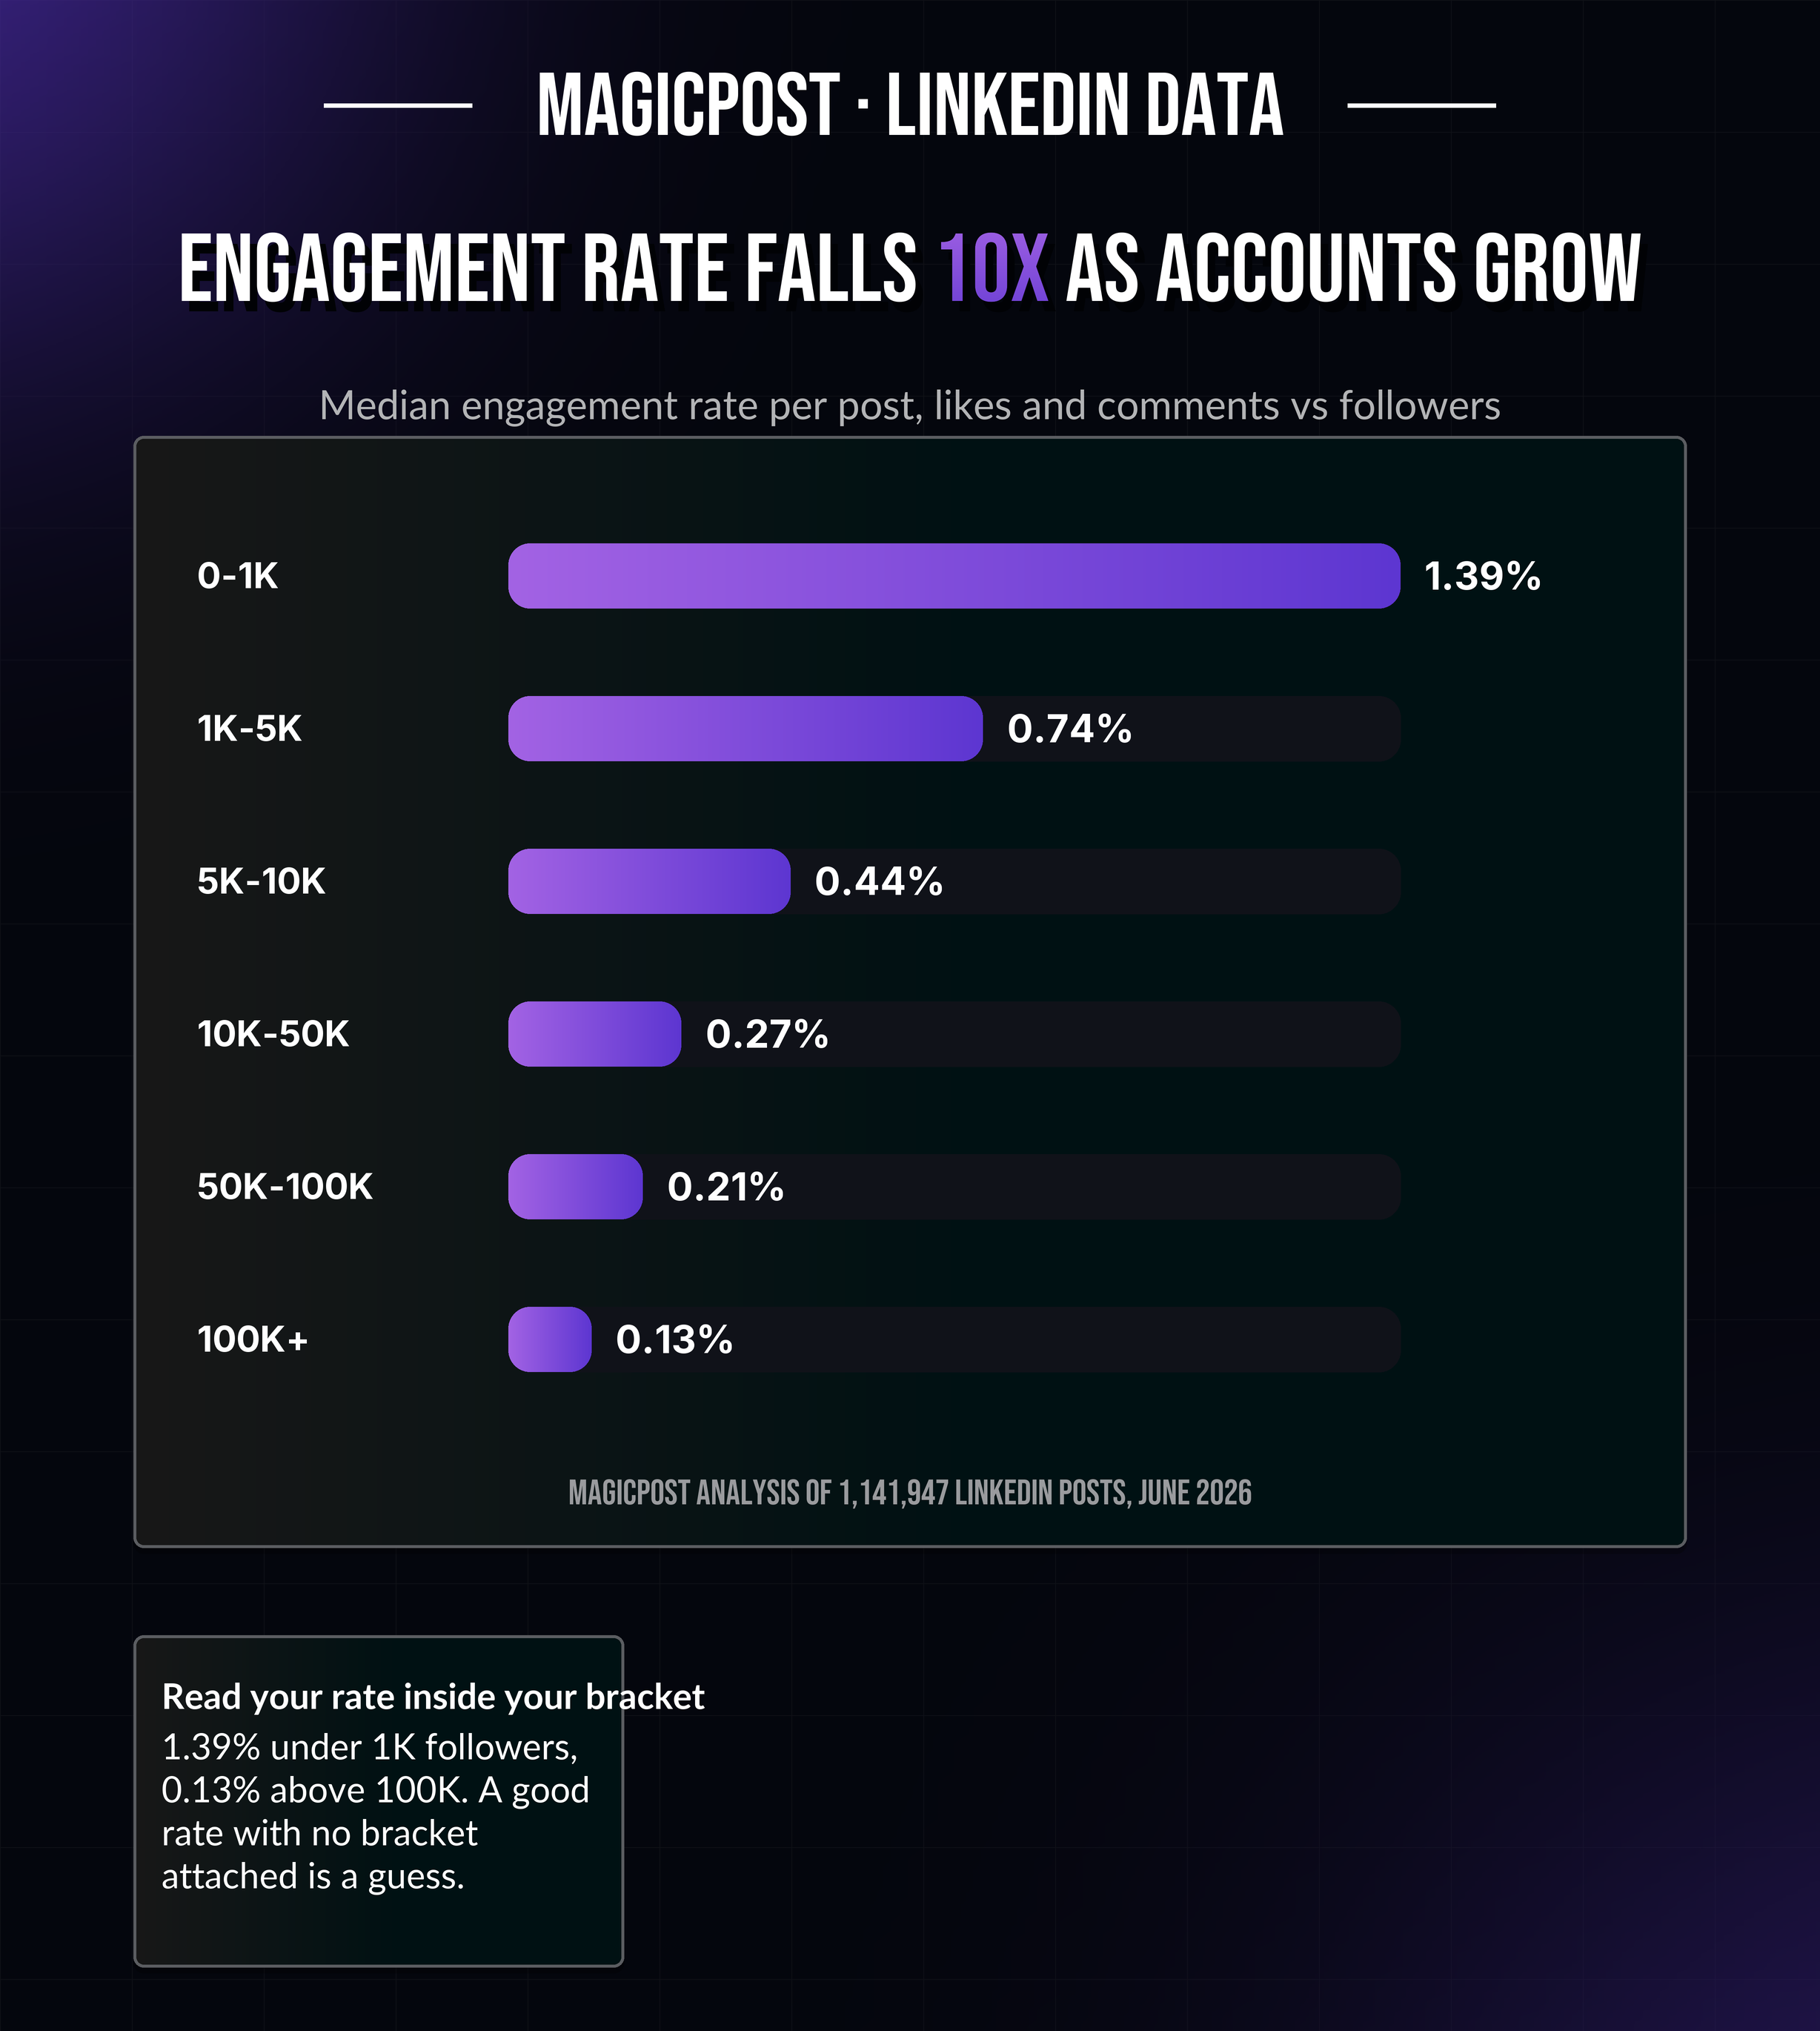
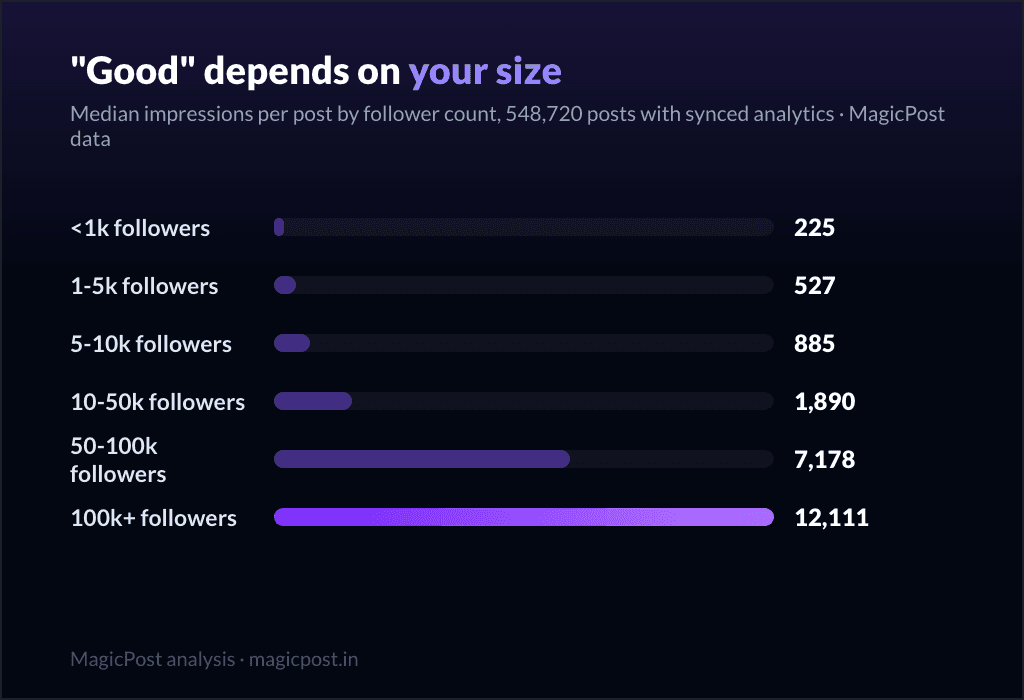
Engagement rate against followers falls roughly 10x as accounts grow: 1.39% median under 1k followers, 0.13% above 100k, on 1,141,947 posts. Without a follower bracket attached, a "good" engagement rate is a guess.
Want your own numbers against creators your size? The MagicPost LinkedIn analytics tool benchmarks every post against your follower bracket, breaks your audience down by country, job family and industry, and exports it all to CSV and PDF, through LinkedIn's official API.
Best LinkedIn analytics tools for personal profiles
The six tools in this group are built for a personal profile first. What separates them is how they get the data (official API, native, extension) and how much context they add on top of it.
1. Kliver Analytics: Best LinkedIn analytics tool when analytics is all you need
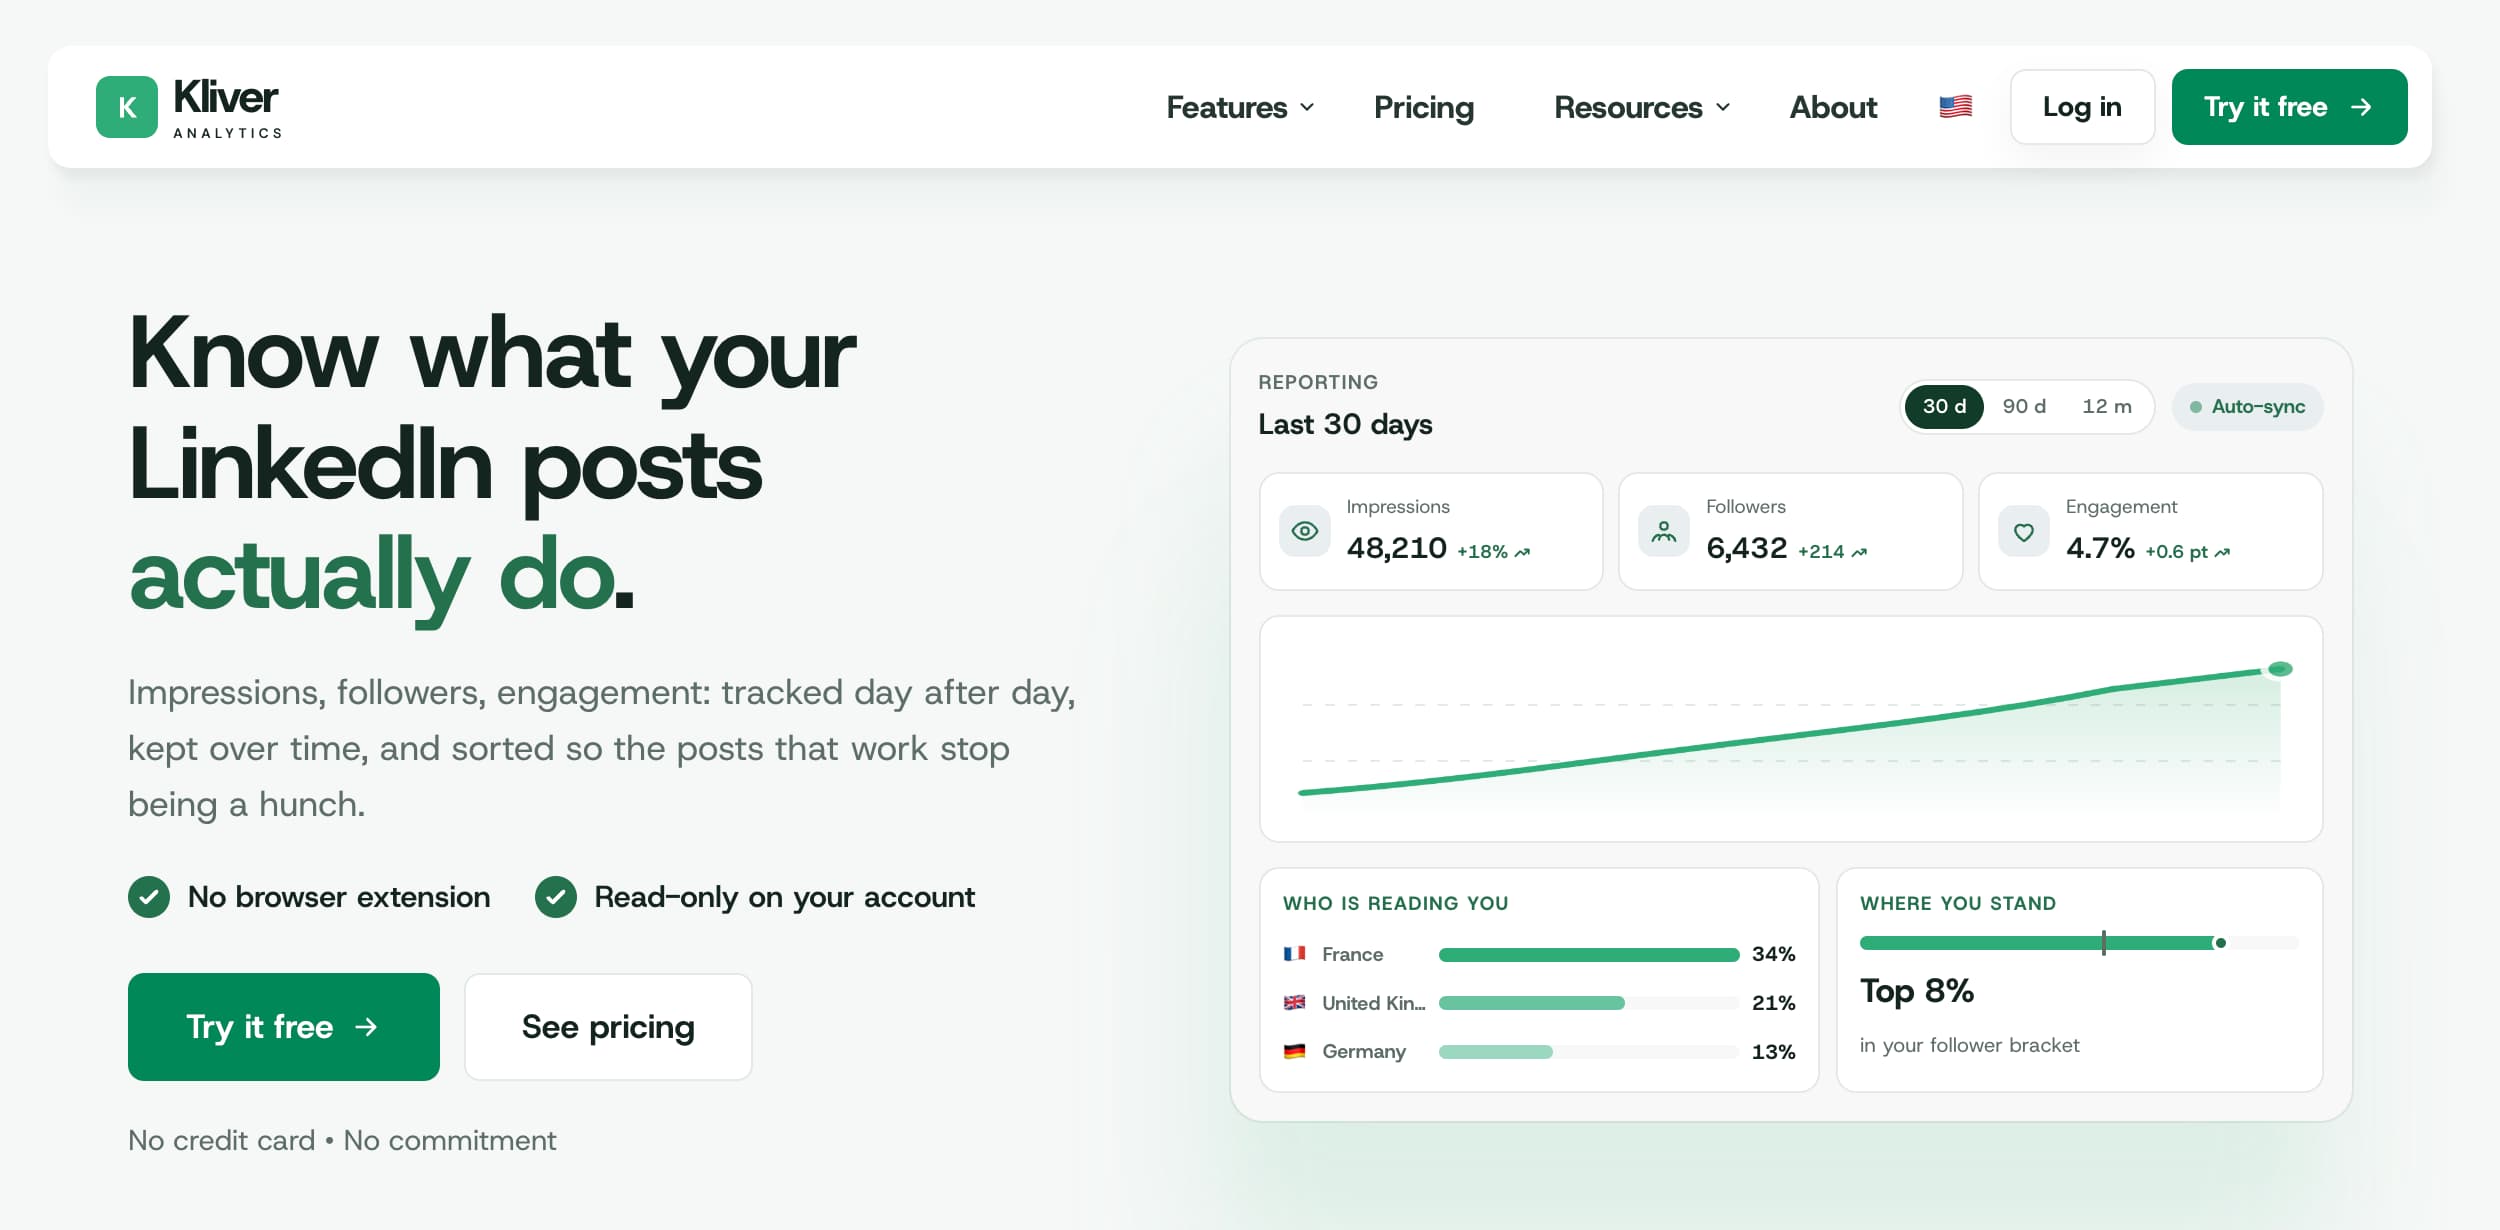
Kliver Analytics is the best LinkedIn analytics tool for a personal profile when you only need analytics: it scores every post against comparable profiles and keeps the metrics LinkedIn drops from its rolling window, for $19 per seat per month.
Kliver Analytics is built by the same company as MagicPost and sold as a separate product. It connects through LinkedIn's official API with OAuth, read-only on your account, with no browser extension and no session cookie.
The history is the first difference. LinkedIn serves recent metrics and lets older ones go; Kliver Analytics keeps them, with 30-day, 90-day and 12-month views of impressions, reactions, comments, reposts, followers gained and engagement rate. Unique views, saves, link clicks and profile clicks are added when LinkedIn exposes them.
Post performance is a sortable table over that whole history, with posts split into bangers, good posts and flops. Audience is built from the people who liked and commented on your last twenty posts: country, job title, company, industry and seniority.
Benchmarks place your numbers against the median of comparable profiles by follower bracket, post format, post length and weekday, with your percentile in the bracket. The same yardstick reads any other public profile, and reports are exportable. A public monthly LinkedIn benchmark and free calculators work without an account.
Kliver Analytics stops at analytics: no editor, no scheduler, no AI writing, no engagement or lead tools.
Key features
History kept beyond LinkedIn's rolling window.
Benchmarks by bracket, format, length and weekday.
Percentile within your follower bracket.
Audience by country, title, company, industry, seniority.
Any public profile read with the same yardstick.
Report export and Kliver MCP.
Pros | Cons |
✅ Keeps the metrics LinkedIn stops showing | ❌ Analytics only: no editor, scheduler, AI writing, engagement or lead tools |
✅ Percentile in your bracket, by format, length and weekday | ❌ Company Page analytics not documented |
✅ Read-only official API, no extension or cookie | ❌ Audience drawn from engagers of the last 20 posts |
✅ Public monthly benchmark and free calculators, no account | ❌ Priced per seat, so a team pays for each profile |
Plan | Price/mo. | Includes |
Kliver Analytics | $19 per seat | History, posts, audience, benchmarks, creators, export |
2 seats or more | $19 per seat | Same plan, seats grouped into an organization |
Free trial with no credit card; no permanent free tier. Plans on the Kliver Analytics pricing page.
2. MagicPost: Best LinkedIn analytics tool if you also write, schedule, engage and capture leads
MagicPost is the LinkedIn analytics tool to pick when the same workspace also writes, schedules, engages and captures leads: it benchmarks a personal profile against its follower bracket and breaks its audience down by country, job family and industry, on the official LinkedIn API.
The dashboard has four tabs. Reporting shows your key figures as medians, a progression chart, best posts, formats, themes and a heatmap of when you publish. Posts lists every post with the advanced columns LinkedIn exposes to API partners: unique views, saves, link clicks, profile clicks, premium CTA clicks.
Audience answers who follows you: countries and cities, job families and seniority, company sizes, industries, account types. Benchmarks answers whether your numbers are good for your size: impressions per follower bracket, formats per bracket, post length and days of the week, each scored against creators with your follower count.
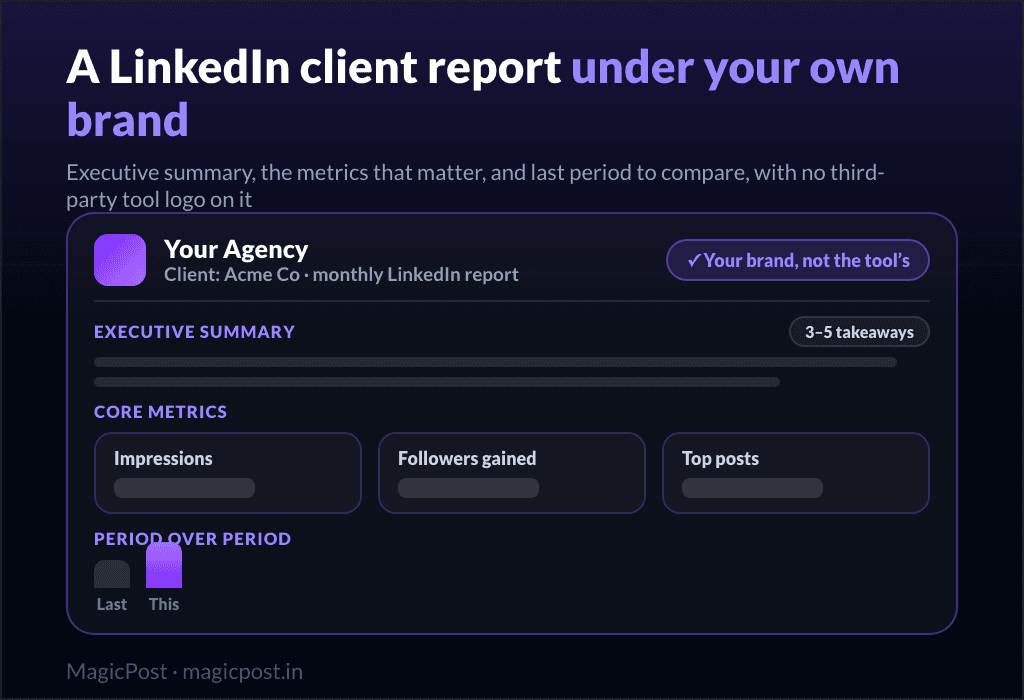
The Posts table exports to CSV exactly as filtered; the Reporting tab builds a multi-page A4 PDF with optional Audience and Benchmarks pages, white-labelled per client on the Agency plan. The same dashboard also opens on any creator's public activity: posts, likes, comments, formats, themes.
Key features
Benchmarks per follower bracket: impressions, formats, length, days.
Audience by country, job family, seniority, industry, size.
Advanced columns: unique views, saves, link and profile clicks.
Filtered CSV export, multi-page A4 PDF, white-label on Agency.
Public activity of any creator, in the same dashboard.
Official LinkedIn API via OAuth; no extension, no cookies.
Pros | Cons |
✅ Bracket benchmarks and audience next to writing, scheduling, engagement feed and lead detection | ❌ LinkedIn only, no other networks |
✅ Filtered CSV and multi-page A4 PDF exports | ❌ Fewer metrics on Company Pages (LinkedIn exposes no saves, profile or CTA clicks there) |
✅ Official API as a LinkedIn-verified application | ❌ White-label client reports on the Agency plan only |
Plan | Price/mo. | Includes |
Growth | $49 | Metrics, benchmarks, audience, exports, scheduling, engagement, lead detection |
Creator | $69 | Growth plus AI writing, scheduled comments, report accent color |
Team / Agency | $59/seat (Team and Agency) | Client workspaces, white-label reports, from 2 members |
Full walkthrough in the MagicPost review.
3. LinkedIn native analytics: Best free baseline (and its limits)
LinkedIn native analytics is the free starting point every other LinkedIn analytics tool is measured against, and it needs no Premium subscription for the core numbers.
Per post, LinkedIn shows impressions, the in-network and out-of-network split, members reached (distinct people), profile viewers, followers gained, reactions, comments, reposts, saves, sends, link visits and video watch time.
The combined view under Profile, Analytics, Post impressions adds a date range, a trend graph, top posts and an .XLSX export.
Audience analytics lists total followers, new followers over a period, and top demographics: job title, location, industry, seniority, company size and company, five entries each. The only Premium gate is "Who viewed your profile after this post".
The limits are the retention windows and the missing context. Engagement counts stay for 1,000 days, members-reached data for 400, demographic breakdowns for 180. LinkedIn states its numbers are estimates.
The missing context is where paid tools come in: no benchmark against other creators, no per-format table over time, no multi-profile view, and nothing on someone else's profile.
Key features
Per-post impressions, reach, engagement and saves.
Combined post analytics with .XLSX export.
Follower demographics: title, location, industry, seniority.
Comment impressions on your own comments.
Free for every member; Premium not required.
Pros | Cons |
✅ Free, official, and the source every tool reads | ❌ No benchmark against creators your size |
✅ Distinct members reached, on top of impressions | ❌ Demographics kept 180 days, reach 400 days |
✅ .XLSX export of the combined view | ❌ No historical per-format comparison |
✅ Engagement counts kept 1,000 days | ❌ Numbers are estimates, per LinkedIn |
Plan | Price/mo. | Includes |
Member | $0 | Post, combined and audience analytics, exports |
Premium | Paid | Adds "Who viewed your profile after this post" |
Every metric is explained in the LinkedIn analytics guide.
4. AuthoredUp: Best for post-by-post comparisons and CSV export
AuthoredUp is the LinkedIn analytics tool to pick when you want every past post in one filterable table, with saves, sends and profile views, and a CSV of it all.
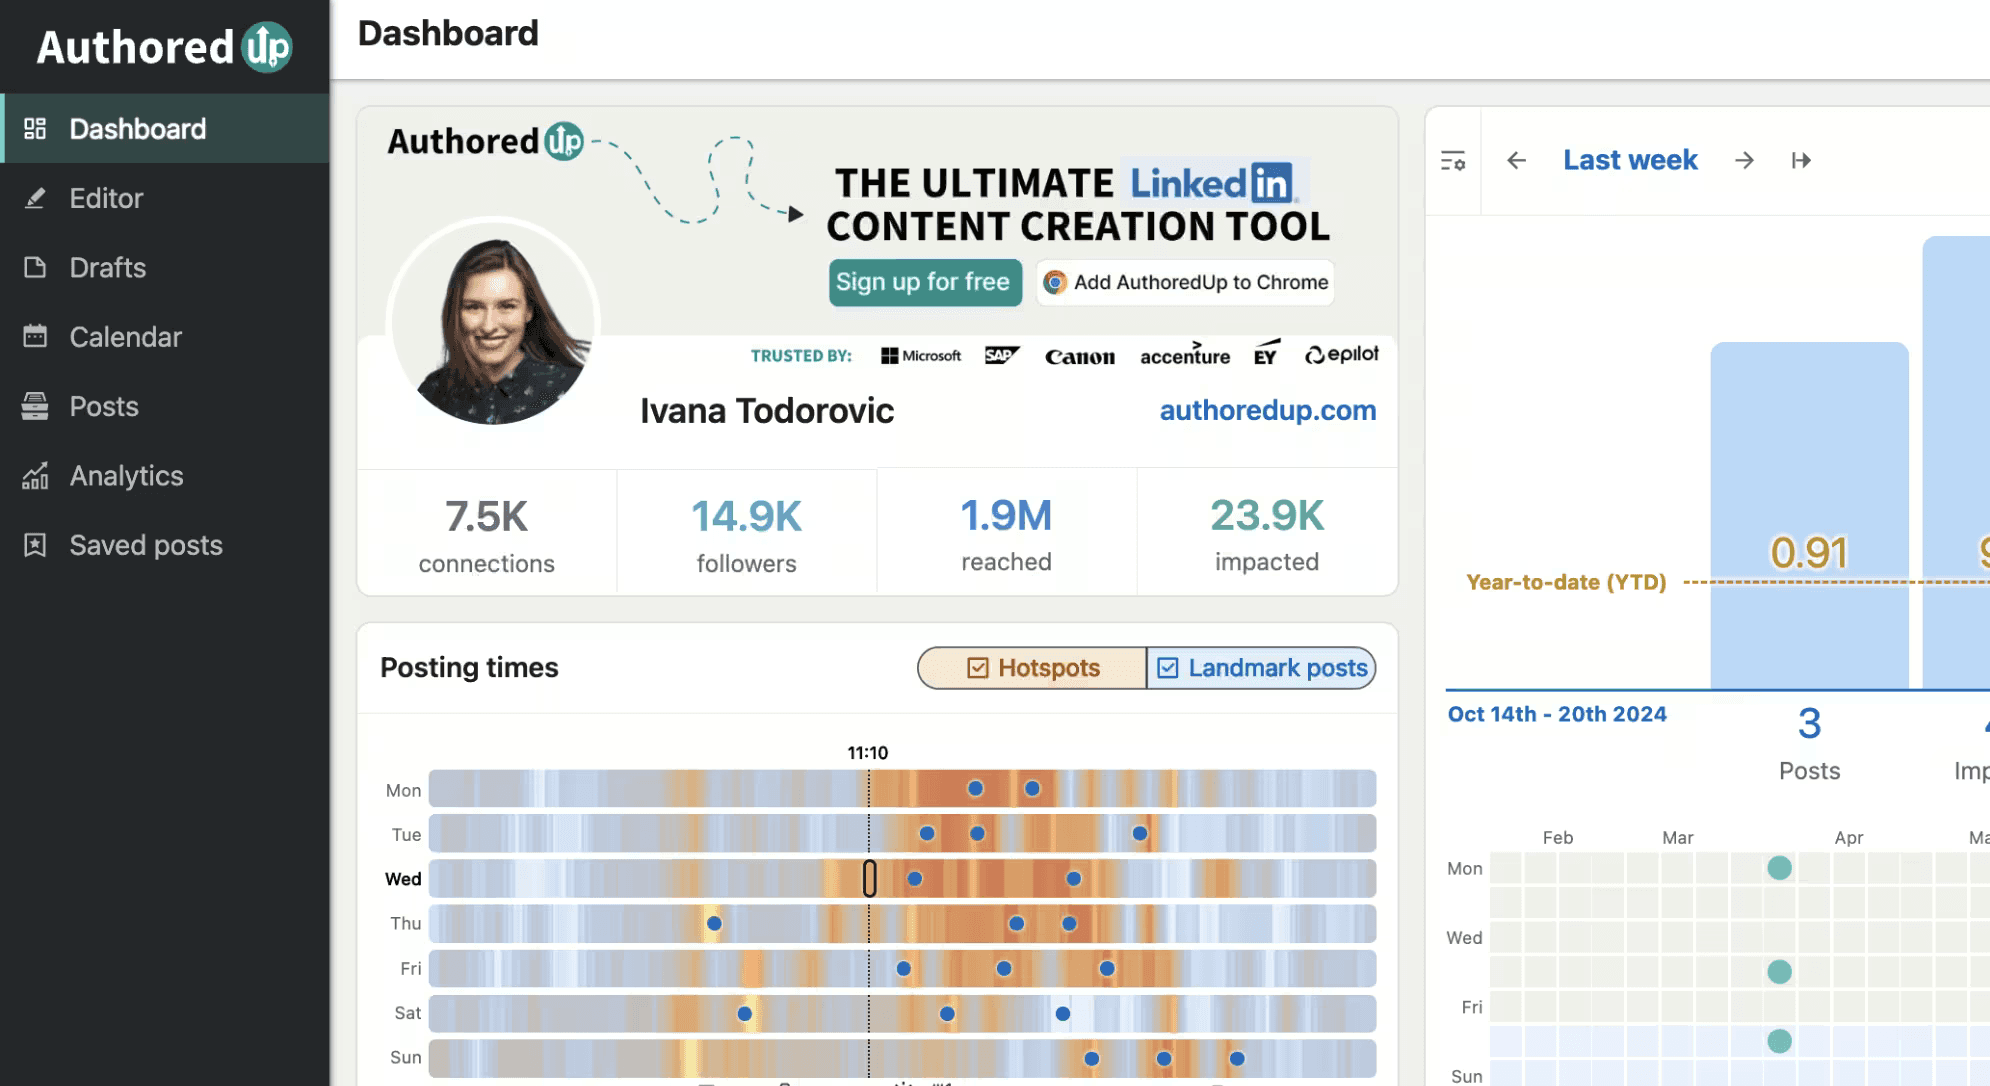
The Chrome extension reads your posts inside your own LinkedIn session, without cookies or automation, and feeds a growth dashboard: advanced stats per post, a historical collection you can filter, a word cloud, and CSV export. Company Pages are included on every plan at no extra cost.
What it does not do is the context layer, and it has no AI writing at all, which is deliberate. One of its own reviewers asks for "suggestions on what type of content to post based on what's worked": exactly that gap.
Key features
Growth dashboard with saves, sends, profile views.
Historical post collection with filters.
CSV export and word cloud.
Company Pages included on any plan.
Post editor, hooks and CTA templates alongside.
Pros | Cons |
✅ The deepest per-post table with CSV | ❌ No benchmark, no audience breakdown |
✅ Extension is read-only, no cookies, no automation | ❌ Reads through an extension, outside the official API |
✅ Pages on every plan, per-profile team pricing | ❌ Business plan needs 3 profiles minimum |
Plan | Price/mo. | Includes |
Individual | $19.95 | 1 profile, full analytics, editor, scheduling |
Business | $14.95 per profile | Min. 3 profiles, team analytics, sub-accounts |
Growth | Custom | Min. 10 profiles, billed annually |
Deeper look in the AuthoredUp review and AuthoredUp alternatives.
5. Taplio: Best for metrics while you browse LinkedIn
Taplio is the LinkedIn analytics tool for creators who want their numbers surfaced inside LinkedIn as they scroll, bundled with an all-in-one writing and outreach suite.
The Taplio X Chrome extension shows follower, engagement and view metrics while you browse, and the web app tracks top-performing posts, views and engagement over time beyond LinkedIn's native dashboard. Analytics sits next to AI writing, a Kanban scheduler, a carousel generator and, on Pro, lead outreach.
The trade-off is the mechanism. Taplio's own support content states the extension is treated by LinkedIn as an automation tool that goes against its Terms of Service, and some users may receive warnings.
Key features
In-feed metrics through the Taplio X extension.
Top posts, views and engagement over time.
AI writing, Kanban scheduling, carousel generator.
Lead database and outreach on Pro.
Pros | Cons |
✅ Metrics visible inside LinkedIn while browsing | ❌ Extension classed as automation by LinkedIn, per Taplio |
✅ Analytics bundled with a full creator suite | ❌ No benchmark, audience or export documented |
✅ Top posts, views and engagement tracked over time | ❌ Trustpilot 2.4/5 on 13 reviews, billing themes |
Plan | Price/mo. | Includes |
Starter | $39 | Suite without AI credits |
Growth | $69 | 250 AI credits, 500 comment credits |
Pro | $199 | Unlimited credits, auto-DMs and connections |
Full verdict in the Taplio review and Taplio alternatives.
6. Supergrow: Best for writing-first creators who need basic analytics
Supergrow is a LinkedIn analytics tool from its Pro plan, and it is the right pick when writing comes first and analytics is a weekly check rather than the reason you pay.
The product is built around AI interviews, Content DNA voice training, voice-to-post and repurposing, with calendar, queue and Kanban scheduling. Profile analytics and weekly reports come with Pro at $39/mo., and Teams adds per-member insights for five accounts.
Analytics is the recurring critique. G2 reviewers note that reporting and analytics could be more detailed, and G2's own summary flags that the analytics features could benefit from improvements. Supergrow's own comparison of LinkedIn analytics tools describes its analytics as not as deep as competitor benchmarking tools.
Same gap as the matrix above: no follower-bracket benchmark, no audience breakdown.
Key features
Profile analytics and weekly reports on Pro.
Team analytics per member on Teams.
AI interviews, Content DNA, voice-to-post.
Calendar, queue and Kanban scheduling.
MCP and public API on Pro.
Pros | Cons |
✅ Strong voice-training layer around the analytics | ❌ No follower-bracket benchmark or audience breakdown |
✅ Weekly reports without setup | ❌ Reporting depth is the recurring G2 critique |
✅ Analytics on every plan | ❌ Official-API claim is stated by the vendor only |
Plan | Price/mo. | Includes |
Pro | $39 | Profile analytics, weekly reports, carousels |
Teams | $199 | 5 accounts, org dashboard, team analytics |
Details in the Supergrow review and Supergrow alternatives.
Best free LinkedIn analytics tools
Both tools in this group are free for good rather than on trial, and they cover different things: Vaizle a Company Page, Buffer basic post stats on a scheduler. LinkedIn native analytics, above, is the third permanent free option.
7. Vaizle: Best Company Page report without a paid plan
Vaizle is the free LinkedIn analytics tool for Company Pages: connect a Page and get a report without a paid plan, but personal profiles are not covered.
Its free LinkedIn tools sit apart from the paid product, an AI marketing-analytics suite that covers ads, social, competitor, Shopify and web analytics across Meta, Google, LinkedIn and TikTok. On LinkedIn, the suite tracks Page analytics and LinkedIn Ads, including competitor ads. Personal-profile analytics is not stated anywhere.
Paid plans are credit-metered under introductory pricing, from AI Lite at $9/mo.: identical features on every tier, different credit allowances. Annual prices are not shown.
Key features
Free LinkedIn Page tools without sign-up.
Page analytics and LinkedIn Ads reporting.
Competitor LinkedIn Ads analytics.
Cross-network social, ads and web analytics.
Pros | Cons |
✅ A real free report for Company Pages | ❌ No personal-profile analytics |
✅ Ads and organic in the same suite | ❌ Credit-metered, introductory prices may change |
✅ Cheap paid entry at $9/mo. | ❌ No follower-bracket benchmark |
Plan | Price/mo. | Includes |
Free tools | $0 | LinkedIn Page tools, no sign-up |
AI Lite | $9 | 1,000 credits, full feature access |
AI Starter | $59 | 10,000 credits |
AI Pro | $119 | 20,000 credits |
8. Buffer: Best free basic post stats
Buffer is the free LinkedIn analytics tool for people who mostly want a scheduler and will read post-level stats on the side.
The Free plan connects up to 3 channels, LinkedIn included, with 10 scheduled posts per channel and one user.
Analytics runs from basic to advanced as you move up the plans, and branded reports arrive on Team. Publishing goes through an official partner-class integration, which is why Buffer has no safety caveat to manage.
LinkedIn depth is the trade, as the matrix above shows. Buffer's own reviewers put it the same way: simple to use, but missing features the native app has.
Key features
Free plan with 3 channels and 10 posts per channel.
Basic to advanced analytics by plan.
Branded reports on Team.
Approval workflows on Team.
Official partner-class LinkedIn integration.
Pros | Cons |
✅ Genuine permanent free plan | ❌ No LinkedIn benchmark or audience data |
✅ Cheapest paid step at $5/mo. per channel | ❌ Post-failure reports in recent reviews |
✅ Replies to reviews, responsive support | ❌ Trustpilot 3.2/5 on 105 reviews |
Plan | Price/mo. | Includes |
Free | $0 | 3 channels, 10 scheduled posts per channel |
Essentials | $5 per channel | Unlimited scheduled posts, first-comment scheduling |
Team | $10 per channel | Unlimited members, approvals, branded reports |
LinkedIn-focused options in Buffer alternatives.
Best LinkedIn analytics tools for teams and agencies
The four tools in this group are multi-network suites priced per account, brand or user, and LinkedIn analytics is one module among several. What separates them is the reporting layer: budget, client dashboards, governance, competitor benchmarking.
Before the tool choice, LinkedIn analytics for agencies sets out how to compare several clients without misleading numbers.
9. SocialPilot: Best budget reporting for many accounts
SocialPilot is the LinkedIn analytics tool for teams that manage many accounts on a budget: 7 accounts for $30/mo., with reporting on every paid plan.
Analytics tracks views, likes, comments and shares on posts and Pages, with customizable Advanced Reports on the higher tiers. Around it sit a content calendar, bulk scheduling of 500+ posts, LinkedIn Document publishing on all paid plans, approval workflows, and multi-user seats from 1 to unlimited.
The gaps are the ones in the matrix above, plus a smaller one: mentions of people are limited to followers of your organization's Page. Its Trustpilot sits at 2.2/5 on 37 reviews, with billing at cancellation the main theme.
Key features
Views, likes, comments, shares per post and Page.
Customizable Advanced Reports on higher tiers.
7 to 50 accounts by plan.
Bulk scheduling, LinkedIn Document publishing.
Approval workflows and client collaboration.
Pros | Cons |
✅ Lowest price per account in this list | ❌ No benchmark, audience or format analytics |
✅ Reporting on every paid plan | ❌ Person mentions limited to Page followers |
✅ LinkedIn Document publishing on all paid plans | ❌ Trustpilot 2.2/5, billing complaints |
Plan | Price/mo. | Includes |
Essentials | $30 | 7 accounts, 1 user, 500 AI credits |
Standard | $50 | 15 accounts, 3 users |
Premium | $100 | 25 accounts, 6 users, advanced reports |
Ultimate | $200 | 50 accounts, unlimited users |
More in the SocialPilot review.
10. Metricool: Best multi-network dashboard for small teams
Metricool is the analytics-first LinkedIn analytics tool among the generalists, with PDF reports and shareable dashboards that agencies name as the reason they stay.
Cross-network analytics is its core, with competitor analysis, ad management, a link-in-bio, an AI assistant and an approval system on Advanced. Publishing runs through an official partner-class integration. Support is the strongest in this list: Metricool answers 97% of negative Trustpilot reviews, usually within a week.
Two things to check before paying. The Free plan excludes LinkedIn, in Metricool's own words, so LinkedIn analytics starts at Starter, $25/mo. for up to 5 brands. And there is no follower-bracket benchmark for a personal profile; the comparison layer is competitor analysis, which one reviewer reports as unreliable.
Key features
Cross-network analytics with competitor analysis.
PDF reports and client-shareable dashboards.
Approval system on Advanced.
Ad management and link-in-bio.
Official partner-class LinkedIn integration.
Pros | Cons |
✅ PDF reports and shared dashboards for clients | ❌ Free plan excludes LinkedIn |
✅ 97% reply rate to negative reviews | ❌ Brand-tiered plans oversized for one profile |
✅ Trustpilot 3.9/5 on 603 reviews | ❌ No personal-profile benchmark |
Plan | Price/mo. | Includes |
Free | $0 | 1 brand, 20 posts, LinkedIn excluded |
Starter | $25 | Up to 5 brands, LinkedIn included |
Advanced | $67 | Up to 15 brands, approvals |
Custom | On request | White label, dedicated manager |
LinkedIn-first options in Metricool alternatives.
11. Hootsuite: Best enterprise suite with LinkedIn analytics
Hootsuite is the LinkedIn analytics tool for enterprises that need profile and Page analytics inside one governed suite, with competitor benchmarking and mandatory reporting tags.
Analytics covers profile and Page posts, top-performer surfacing, engagement and reach, competitor benchmarking, and a Best Time to Publish recommendation; a December 2025 update sped up the refresh of LinkedIn metrics.
Professional and Advanced tiers add message tagging and let admins require reporting tags on every published post, so client reports stay clean.
The price is enterprise-grade and per user: Standard starts at $99 per user per month billed annually, and monthly billing is not published. Its Trustpilot is 1.3/5 on 554 reviews, with billing, cancellation and support as top mentions.
Key features
Profile and Page post analytics, top performers.
Competitor benchmarking.
Best Time to Publish.
Mandatory reporting tags on Professional+.
Unified inbox, approvals, advocacy on Enterprise.
Pros | Cons |
✅ Profile and Page analytics with competitor benchmarking | ❌ Per-user pricing from $99, annual billing only published |
✅ Reporting-tag taxonomy for clean client reports | ❌ Trustpilot 1.3/5 on 554 reviews |
✅ Best Time to Publish recommendation | ❌ No follower-bracket benchmark for personal profiles |
Plan | Price/mo. | Includes |
Standard | $99 per user, billed annually | Up to 10 social accounts |
Professional | $199 per user, billed annually | Unlimited accounts, tagging |
Advanced | $399 per user, billed annually | Approvals and team routing |
Enterprise | Custom | Advocacy, listening |
Pros and cons in the Hootsuite review and Hootsuite alternatives.
12. Socialinsider: Best competitor benchmarking for Company Pages
Socialinsider is the LinkedIn analytics tool for brands and agencies that need to benchmark Company Pages against competitors, with history that grows with the plan.
It is analytics only, no publishing. Cross-network analytics, competitor benchmarking and reports are the core, with history of 3 months on Adapt, 6 on Optimize and 12 on Predict. An API add-on and a Looker Studio connector, $100/mo. each, plug the data into your own reporting.
It does not cover personal profiles, so creators and ghostwriters running individual accounts are outside its scope. Plans are priced per social account, from Adapt at $82/mo. for 20 accounts, with extra profiles at $6/mo. and extra seats at $15/mo.
Key features
Competitor benchmarking for Company Pages.
3 to 12 months of history by tier.
Cross-network reports.
API and Looker Studio add-ons.
Pros | Cons |
✅ Competitor benchmarking built in | ❌ No personal-profile analytics |
✅ 20 to 40 accounts per plan | ❌ History capped at 3 months on entry plan |
✅ API and Looker Studio connectors | ❌ Add-ons at $100/mo. each |
Plan | Price/mo. | Includes |
Adapt | $82 | 20 accounts, 3 months history, 1 seat |
Optimize | $124 | 30 accounts, 6 months, 2 seats |
Predict | $199 | 40 accounts, 12 months, 5 seats |
Enterprise | Custom | Price calculator on request |
LinkedIn analytics tools that shut down or rebuilt (Shield, Kleo)
Two names still show up in searches for LinkedIn analytics tools: one closed, the other came back as a different product.
Shield Analytics launched in 2018 and became the reference for creator analytics. It ran through a Chrome extension outside LinkedIn's official API and outside Chrome Web Store policies.
Its founder's LinkedIn post in May 2026 was explicit: "both google and linkedin made it clear to us that we couldn't continue operating Shield the way we built it".
If you still have data in Shield, export it now. The replacements are compared in Shield Analytics alternatives.
Kleo built its audience as an in-LinkedIn Chrome extension with 70,000+ users, withdrawn on June 20, 2025 after LinkedIn required its removal.
It relaunched as a paid web app for writing and publishing; Kleo V3 lists "performance insights with analytics", with no depth, exports or benchmarks documented. Details in the Kleo review and the Kleo alternatives guide.
The pattern behind both is why the data-access column matters. Extensions that read your session sit outside LinkedIn's developer program, and LinkedIn has enforced against them repeatedly: Kleo (June 2025), Lempod (2025), Shield (May 2026). An official-API LinkedIn analytics tool cannot lose its data source that way.
What good LinkedIn analytics look like: the numbers to compare against
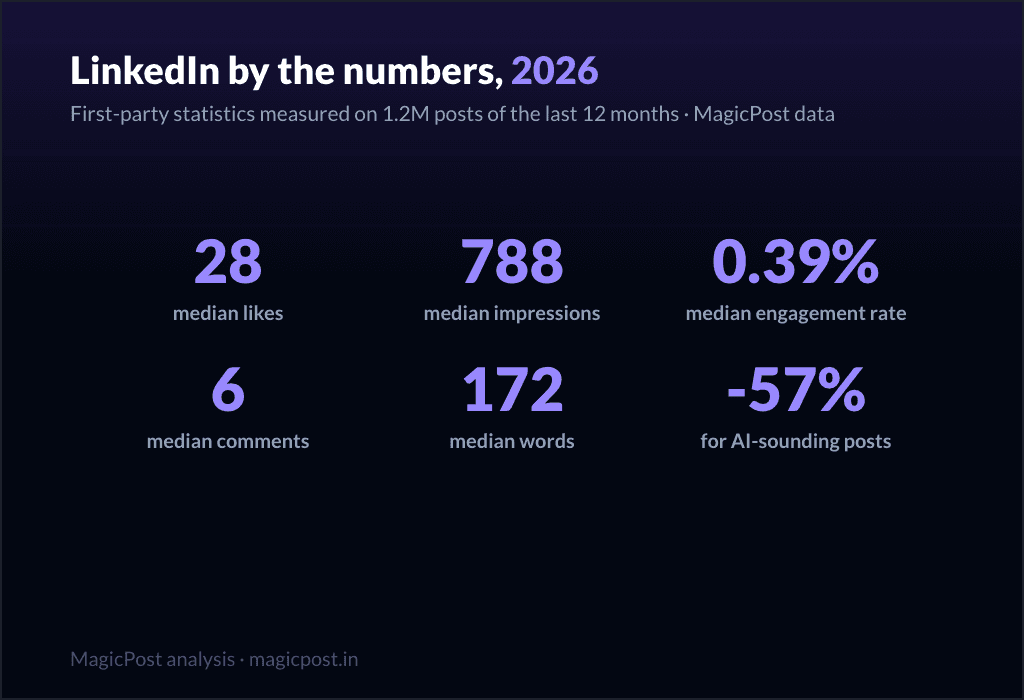
Whichever LinkedIn analytics tool you pick, you need reference numbers to read your dashboard. These are first-party, measured by MagicPost on public posts, and they refresh monthly.
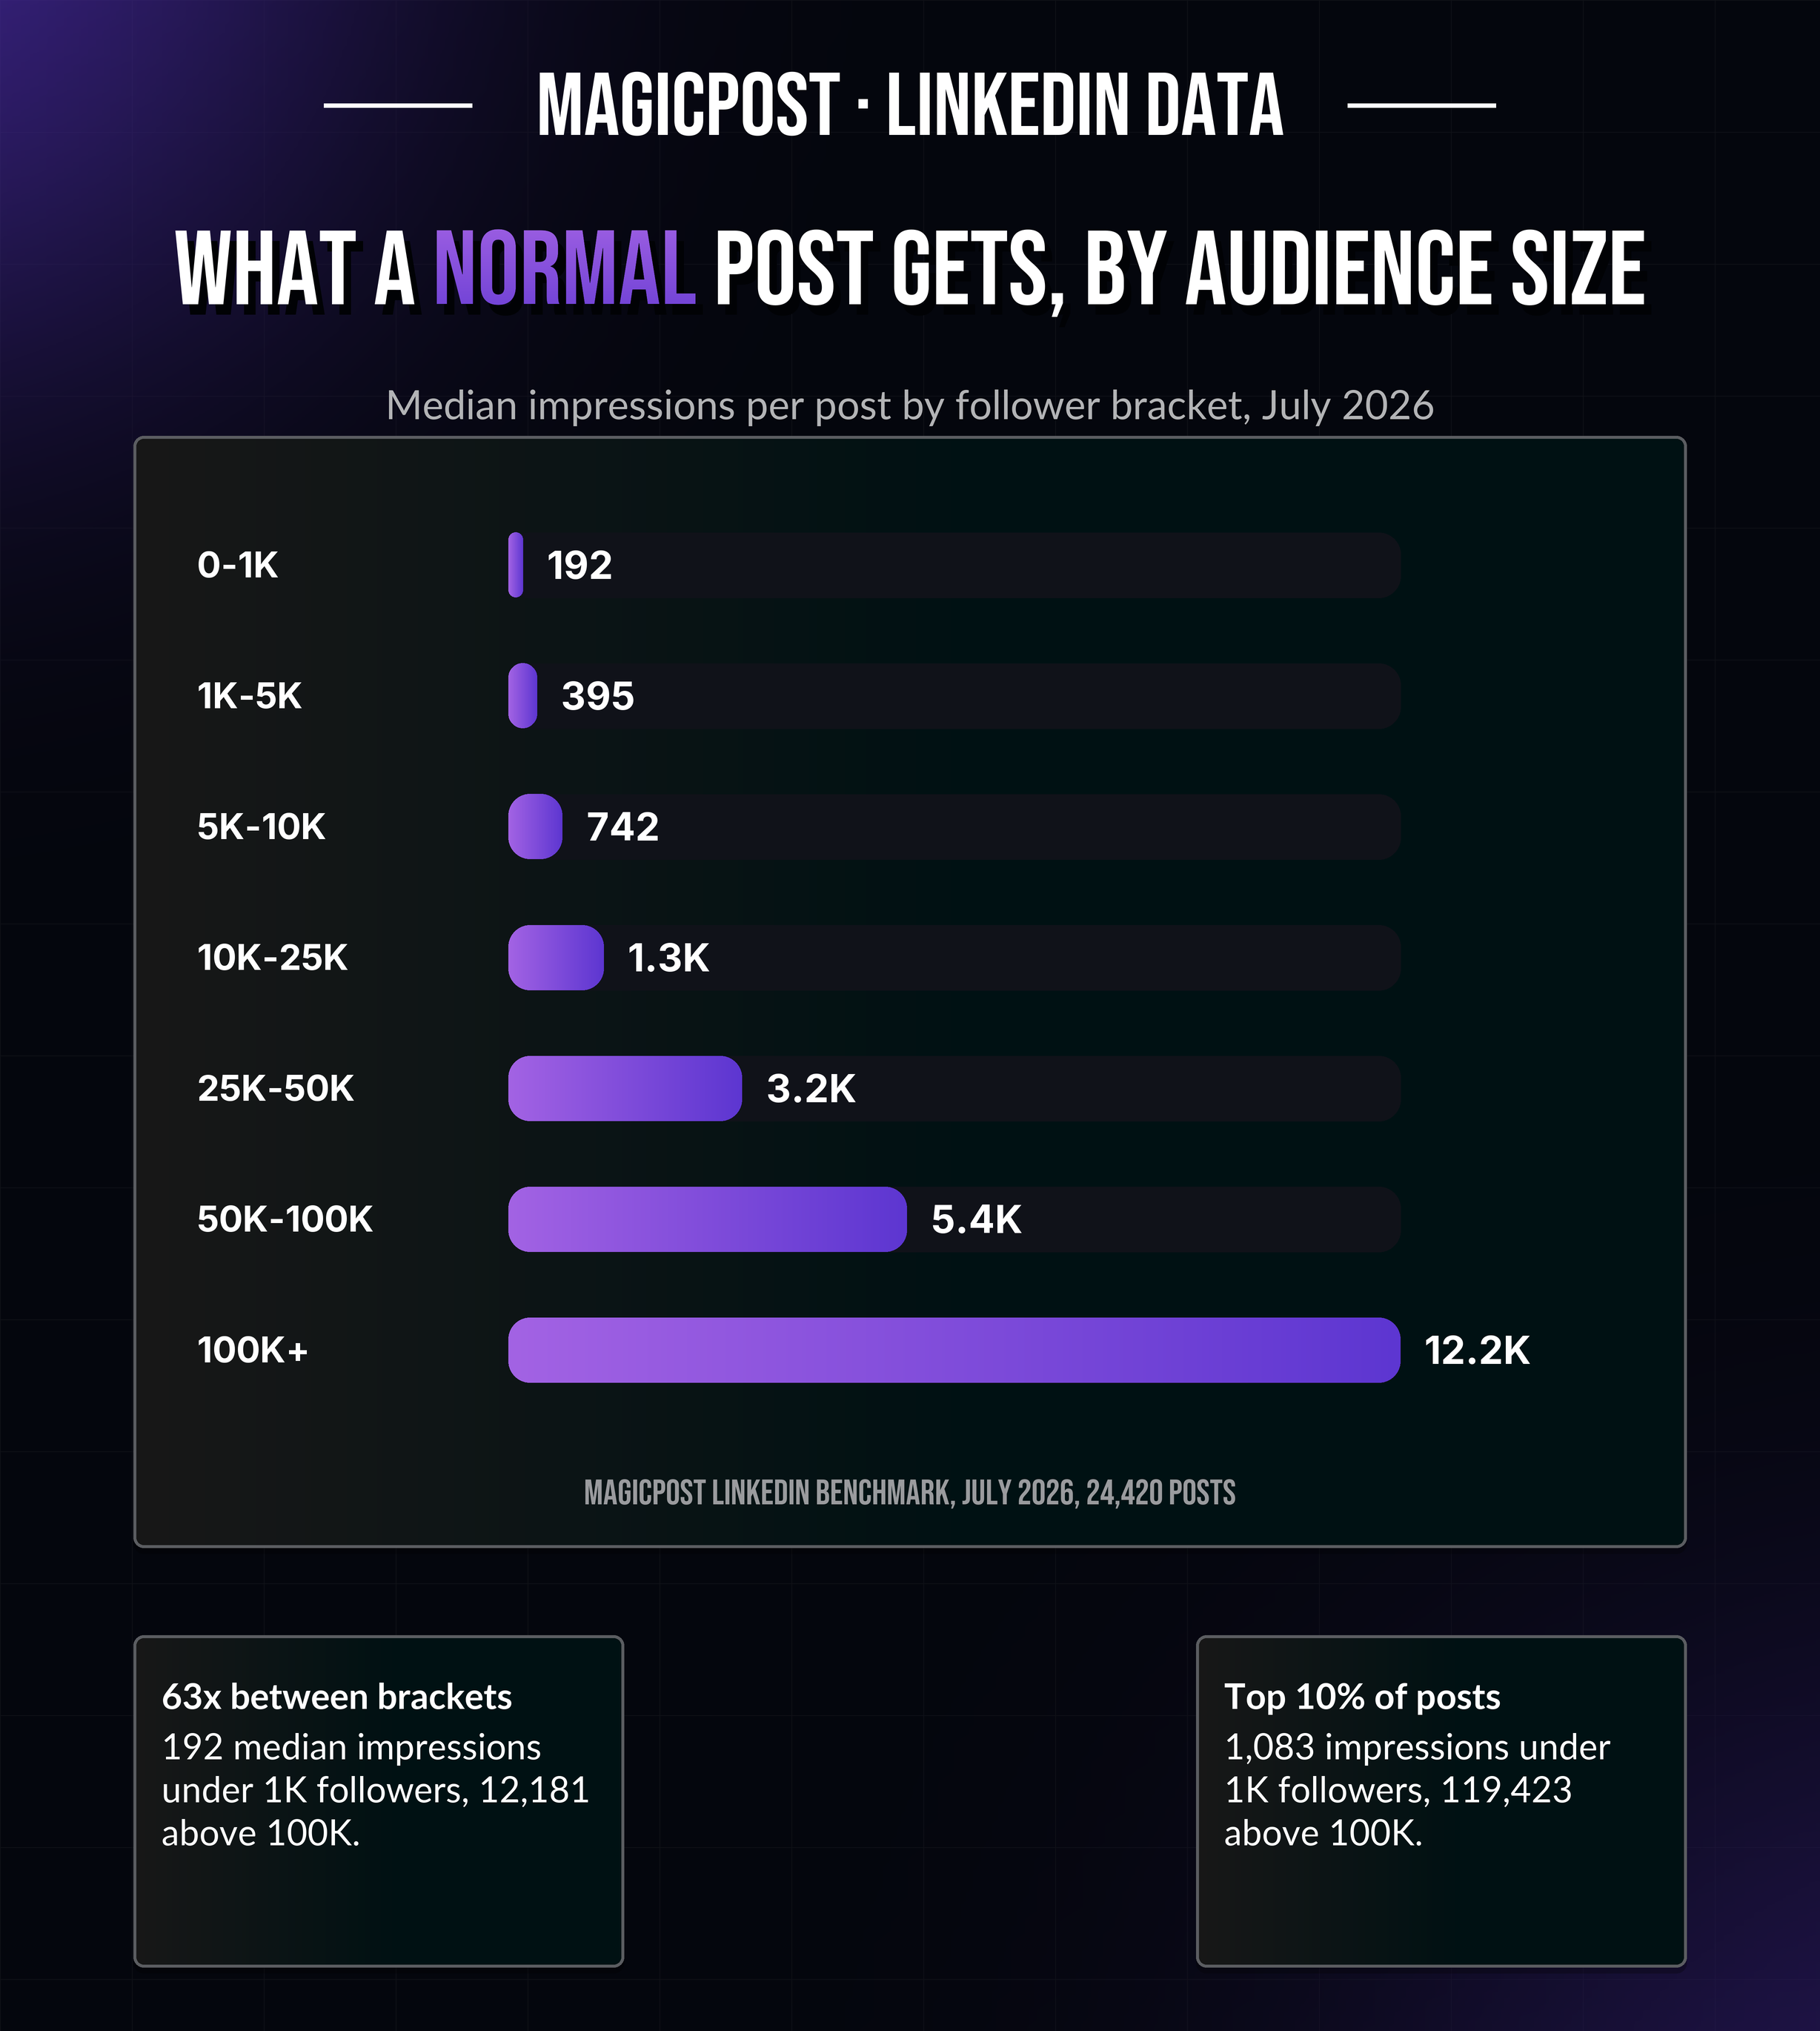
Median impressions per post by follower bracket, July 2026 edition, 24,420 posts:
Followers | Low (bottom 25%) | Median | High (top 25%) | Top 10% |
0-1K | 80 | 192 | 452 | 1,083 |
1K-5K | 159 | 395 | 1,026 | 2,896 |
5K-10K | 305 | 742 | 2,028 | 6,071 |
10K-25K | 477 | 1,306 | 3,897 | 11,557 |
25K-50K | 1,312 | 3,196 | 9,058 | 27,708 |
50K-100K | 2,151 | 5,446 | 15,840 | 42,412 |
100K+ | 4,661 | 12,181 | 34,273 | 119,423 |
The current edition, with the previous month's deltas and engagement rates per bracket, lives on the LinkedIn impressions benchmark.
Across the wider corpus of 1.2M posts, the reference points are:
788 median impressions per post, on 539,310 posts with synced analytics.
0.39% median engagement rate against followers; 2.63% against impressions.
1.39% engagement under 1k followers, 0.13% above 100k.
414 median impressions with a link card versus 795 without.
71,734 impressions for a top-1% post.
Median likes by format: image 34, carousel 34, video 33, text 16.
Best day to post: Tuesday.
Cite them as "MagicPost analysis of 1.2M LinkedIn posts, June 2026", with a link to the LinkedIn statistics page.
If your median sits inside your bracket's Low to High range, your numbers are normal. If one format or day beats the others in your bracket and you never use it, that is your next experiment.
How to choose the best LinkedIn analytics tool
Run the five checks in this order; each one removes tools from the list before you compare prices.
Profile or Page first. Personal profiles: Kliver Analytics, MagicPost, AuthoredUp, Taplio, Supergrow and native analytics. Company Pages only: Vaizle and Socialinsider. Both: the generalists. A Page tool on a personal-brand problem answers nothing.
Demand a benchmark for your size. Engagement falls 10x between small and large accounts; if the tool cannot place you in a follower bracket, every "good or bad" verdict is a guess.
Ask who follows you, not just how many. Native analytics gives five entries per demographic for 180 days. If you target a job family or an industry, Kliver Analytics breaks down the people who engage with your posts, and MagicPost breaks down your followers across 7 dimensions.
Match the export to the reader. A CSV for your spreadsheet (AuthoredUp, MagicPost), a report export (Kliver Analytics), a PDF or shared dashboard for a client (Metricool, MagicPost), reporting tags for a governed team (Hootsuite), white-label per client (MagicPost Agency).
Check the data access column before the price. Official API or partner integration keeps working; a session-reading extension is the mechanism Shield and Kleo lost.
For the export files themselves, how to export LinkedIn analytics compares the native files with the CSV and the PDF.
On the benchmark, Kliver Analytics and MagicPost both compare a personal profile's posts with the median of its follower bracket; Hootsuite, Metricool and Socialinsider benchmark competitor Pages instead.
So the best LinkedIn analytics tool for analytics alone is Kliver Analytics, at $19 per seat per month. MagicPost comes second, and first when one tool also has to write, schedule, engage and capture leads.
On data access, three cases need a closer look. Taplio's own support says its extension is classed as automation by LinkedIn; AuthoredUp's is read-only without cookies; Supergrow's official-API line is a vendor claim.
See where you really stand. MagicPost benchmarks every post against creators your size, shows who actually follows you, and exports it all to CSV and PDF, through LinkedIn's official API, no extension. Try MagicPost for free →
FAQ
Does LinkedIn have its own analytics tool?
Yes. LinkedIn gives every member free analytics: per-post impressions, members reached, reactions, comments, reposts, saves and profile viewers, a combined view with an .XLSX export, and follower demographics. Premium is only required for "Who viewed your profile after this post".
What it lacks is a benchmark against other creators, per-format history and anything on someone else's profile.
What is the best LinkedIn analytics tool?
Kliver Analytics is the best LinkedIn analytics tool for personal profiles when analytics is all you need: it benchmarks every post against your follower bracket, keeps the history LinkedIn drops, and connects read-only through LinkedIn's official API, at $19 per seat per month.
MagicPost is the best pick if you also write, schedule, engage and capture leads: bracket benchmarks, a 7-dimension audience breakdown and CSV and PDF exports sit next to the content tools, from $49/mo.
For Company Pages with competitor benchmarking, Socialinsider from $82/mo.; for post-by-post CSV comparisons, AuthoredUp at $19.95/mo.; G2 reviewers most often ask for more detail in Supergrow's Pro analytics.
Is there a free LinkedIn analytics tool?
Three LinkedIn analytics tools are free for good: LinkedIn native analytics, Vaizle's Page tools and Buffer's Free plan.
LinkedIn native analytics is free for every member on profiles and Pages. Vaizle offers free LinkedIn tools for Company Pages only. Buffer's Free plan covers 3 channels with basic post stats.
Everything else in this list is a trial, the no-card trials of Kliver Analytics and MagicPost included.
What LinkedIn metrics should I track?
Track impressions and members reached for distribution, engagement rate against impressions for resonance, saves and profile clicks for intent, and follower growth over time. Then read each against your follower bracket.
The median post earns 788 impressions and a 2.63% engagement rate against impressions across 1.2M posts, but a 0-1K account sits at 192 median impressions and a 100K+ account at 12,181 in the July 2026 benchmark.
Can I see analytics for another creator's posts?
Yes, for their public activity only. Kliver Analytics reads any public profile with the same yardstick as your own, and MagicPost shows a creator's posts, likes, comments, formats and themes from the same dashboard.
Impressions, engagement rate against impressions and follower demographics are private to the account owner, and no LinkedIn analytics tool can show them for someone else.
Are third-party LinkedIn analytics tools safe?
LinkedIn analytics tools are safe when they read your data through the official API or a partner-class integration, less so when they read your browser session. Kliver Analytics, MagicPost, Buffer and Metricool are in the first group: they operate inside LinkedIn's developer program with an authorisation you can revoke.
Session-reading Chrome extensions sit outside it: Shield closed for that reason, Kleo's extension was withdrawn at LinkedIn's request, and Taplio's support states its extension is treated as an automation tool. Check the mechanism before the feature list.
What replaced Shield Analytics?
No single tool inherited Shield. On the official API, Kliver Analytics covers creator analytics alone, with bracket benchmarks and a history kept beyond LinkedIn's window; MagicPost adds benchmarks and audience data to writing and scheduling.
AuthoredUp keeps post-by-post history with CSV export, and native analytics shows the rest. The full comparison is in Shield Analytics alternatives.
How much do LinkedIn analytics tools cost per month?
LinkedIn analytics tools cost from $0 to $199 per month, at each vendor's monthly billing price.
Free: LinkedIn native, Vaizle's Page tools, Buffer's Free plan.
Creator tools: Kliver Analytics $19/mo. per seat, MagicPost $49/mo., AuthoredUp $19.95/mo., Taplio $39/mo., Supergrow $39/mo.
Team suites: Metricool $25/mo., SocialPilot $30/mo., Socialinsider $82/mo., Hootsuite $99 per user per month billed annually.