" height="26.80529977783203px" id="tymKb8bqC" width="128.00300311279295px"/><path d="M 0 2.417 L 0 0 L 12.909 0 L 12.909 2.417 Z" fill="rgb(126, 78, 253)" height="2.417099999999998px" id="aYr4em6zK" transform="translate(128.341 22.325)" width="12.908999999999992px"/></svg>)
"/><stop offset="1" stop-color="rgb(118, 37, 250)"/></linearGradient></defs><g d="M 19.242 21.22 L 19.362 6.204 L 19.272 6.204 L 13.757 21.22 L 10.161 21.22 L 4.796 6.204 L 4.706 6.204 L 4.825 21.22 L 0 21.22 L 0 0 L 7.283 0 L 12.109 13.607 L 12.229 13.607 L 16.844 0 L 24.247 0 L 24.247 21.22 Z M 26.421 26.113 L 26.421 23.445 L 41.407 23.445 L 41.407 26.113 Z" fill="transparent" height="26.112508199679183px" id="DvfaAIHYn" width="41.40731898311435px"><path d="M 19.242 21.22 L 19.362 6.204 L 19.272 6.204 L 13.757 21.22 L 10.161 21.22 L 4.796 6.204 L 4.706 6.204 L 4.825 21.22 L 0 21.22 L 0 0 L 7.283 0 L 12.109 13.607 L 12.229 13.607 L 16.844 0 L 24.247 0 L 24.247 21.22 Z" fill="rgb(46, 46, 46)" height="21.220180016149442px" id="pLsxRCobd" width="24.247352589074694px"/><path d="M 0 2.668 L 0 0 L 14.986 0 L 14.986 2.668 Z" fill="url(%23yD9d4I5GR-3279285344-linear-gradient)" height="2.6675085048549647px" id="yD9d4I5GR" transform="translate(26.421 23.445)" width="14.986002836263765px"/></g></svg>)

Naïlé Titah
"What should I post on LinkedIn?" usually gets answered with a gut feeling. Here it gets answered with 1,141,932 posts from the last 12 months, each one sorted into a content type by our classifier and scored by engagement rate, so the types rank against each other rather than against anyone's intuition.
One distinction first, because the whole article depends on it. Types are what a post IS: a win you are celebrating, a lesson you learned, a launch you are announcing. Formats are the medium it travels in: an image, a video, a carousel.
The two are independent. You can announce a launch as a video or as plain text, and the type and the format each move engagement on their own axis. This page ranks the types; the format question lives in the best LinkedIn post format (ranked by median likes) and engagement rate by post format (the same axis as here, but for the medium).
The headline, before the table: lived experience crushes promotion, by roughly four to one.
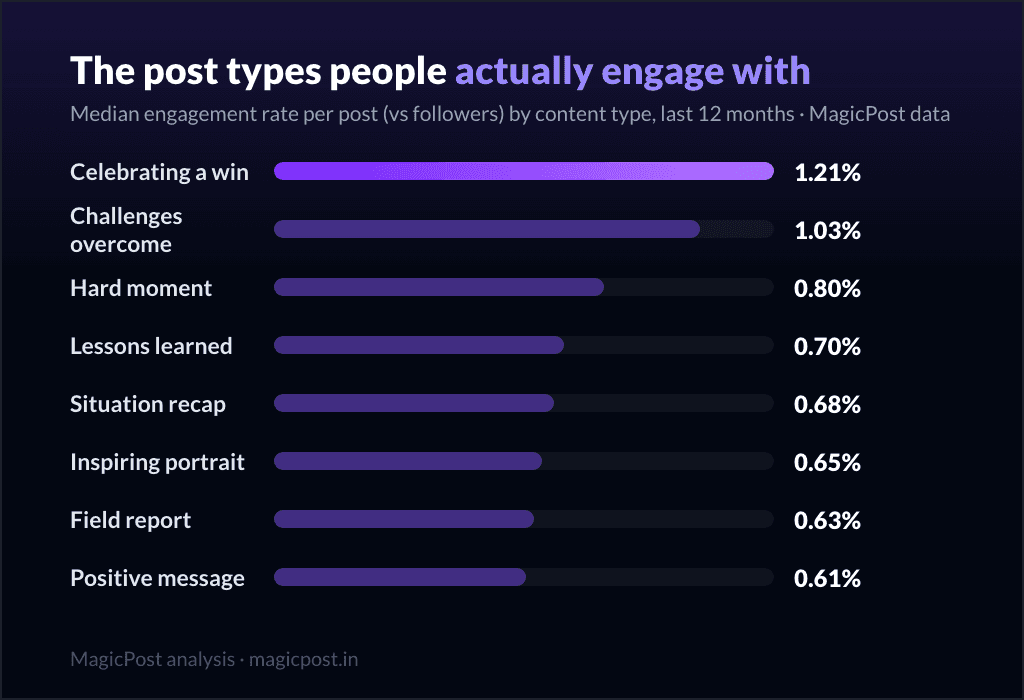
TL;DR: Celebrating a win is the highest-engaging LinkedIn post type (1.21% median engagement rate), with challenges overcome (1.03%) right behind. Promotional types trail: podcast shares 0.29%, webinar pushes 0.31%. Lived experience beats promotion by 4x.
The ranking: every post type, by engagement rate
Engagement rate here is (likes + comments) divided by the author's follower count, computed per post, then taken as the median so no viral outlier bends a row. (We say "versus followers" once and mean it everywhere on this page.) Every type below has at least 3,000 posts behind it.
LinkedIn post type | Median ER (vs followers) | Median likes | Median comments | Posts measured |
Celebrating a win | 1.21% | 66 | 11 | 23,877 |
Challenges overcome | 1.03% | 51 | 14 | 16,823 |
Hard moment | 0.80% | 47 | 16 | 3,234 |
Lessons learned | 0.70% | 32 | 8 | 24,803 |
Situation recap | 0.68% | 45 | 9 | 11,729 |
Inspiring portrait | 0.65% | 53 | 10 | 17,198 |
Field report | 0.63% | 38 | 8 | 6,496 |
Positive message | 0.61% | 43 | 11 | 32,047 |
Personal reflection | 0.58% | 26 | 8 | 21,010 |
Best practices | 0.52% | 28 | 9 | 26,006 |
Tips / rules list | 0.49% | 57 | 23 | 9,520 |
Contrarian take | 0.49% | 40 | 14 | 8,357 |
Quick tip | 0.46% | 29 | 8 | 3,684 |
Punchy advice | 0.44% | 28 | 10 | 142,301 |
Launch announcement | 0.43% | 36 | 5 | 48,105 |
Useful resources | 0.42% | 51 | 11 | 8,331 |
Company saga | 0.42% | 35 | 7 | 3,379 |
Explainer / analysis | 0.40% | 21 | 4 | 83,180 |
Comment-gated lead magnet | 0.40% | 39 | 17 | 11,530 |
Value-first selling | 0.33% | 34 | 11 | 57,659 |
Webinar signup push | 0.31% | 32 | 6 | 51,864 |
Podcast / video share | 0.29% | 36 | 7 | 32,031 |
For scale: the median LinkedIn post of any type earns a 0.39% engagement rate versus followers (the pillar number). So a "celebrating a win" post at 1.21% runs at roughly three times the platform median, and a "podcast / video share" at 0.29% runs below it.


The one pattern that explains the whole table
Read the table from both ends and the same line appears. The top is first-person and emotional: a win (1.21%), a challenge you came through (1.03%), a hard moment you are still in (0.80%), a lesson it taught you (0.70%). The bottom is you asking the reader to do something for you: watch your podcast (0.29%), sign up for your webinar (0.31%), buy the thing your value-first post is softening them up for (0.33%).
The mechanism is not complicated. Engagement follows giving, not asking. A post that hands the reader an emotion or an insight gets repaid in likes and comments; a post that asks the reader to spend attention on your funnel is a withdrawal, and the audience prices it accordingly. The four-to-one gap between the top (1.21%) and the bottom (0.29%) is the gap between offering something and requesting something.
The comments column says it more sharply. The "hard moment" type pulls 16 median comments off only 47 median likes, and "challenges overcome" pulls 14.
Vulnerability is the strongest comment magnet on the platform: people reply to a struggle far more readily than to a how-to. Promotional types sit at the other end (a launch announcement gets 5 median comments), because there is nothing to say back to an ad.
The rows worth a second look
The clean top-to-bottom story has a few wrinkles, and they are where the useful nuance lives.
Tips / rules list (0.49%) vs Punchy advice (0.44%). The classic "5 rules I wish I knew" listicle beats generic punchy advice, but only by a hair on rate. Where it pays off is raw volume: a tips/rules list earns 57 median likes and a remarkable 23 median comments, the highest comment count in the whole table, against punchy advice's 28 and 10. The listicle premium is real, but it is a premium on reach, not on rate. Hold that thought; it comes back below.
Contrarian take (0.49%). The "unpopular opinion" gambit is mid-table, not top. Provocation buys comments (14 median) because people argue, but it does not buy the affection a genuine win or struggle does. If your whole strategy is hot takes, the data says you are trading warmth for a fight and landing in the middle of the pack.
Launch announcement (0.43%). Better than the promotional floor, and that is the point. Asking people to sign up (0.31%) or watch (0.29%) underperforms, but announcing that you launched something still beats them, because other people's launches are events, not ads. A launch is a milestone you are sharing, which puts it closer to the "win" family than to the "click here" family. Announce the milestone; do not beg for the click.
Useful resources (0.42% rate, but 51 median likes). This row is the confounder caught in the act. Its engagement rate is near the bottom, yet its median likes (51) sit with the top performers. Why? Bigger accounts post the "here is a resource" type more often, and a bigger account collects more raw likes while its rate is mechanically diluted by a huge follower denominator. The likes look great; the rate is the truer read of efficiency. That is exactly why every row carries the rate, the likes and the sample size side by side: read any one column alone and you will fool yourself. (The same size confounder runs through every cut of this data, from topic to format.)
How reliable is this classification?
Reliable enough to trust the ranking, with three caveats worth stating plainly.
Types are assigned by our content classifier on the post text, not declared by the author. It reads what the post is doing and labels it. It is good, not perfect.
A real post can blend types. A "lessons learned" post that ends with a soft pitch is both a lesson and a value-first sell; the classifier picks the dominant one. The cleaner a type's intent, the cleaner its number.
We only keep types with at least 3,000 posts, so every rate above is a stable median, not a small-sample fluke. (One type in our label set, "Rant," fell below that floor and is not ranked.)
None of this changes the headline, because the headline is a gap of four-to-one across tens of thousands of posts per type, not a photo finish between two rows.
Where do your post types actually land? MagicPost's LinkedIn analytics score every post you publish by engagement rate, against your own history, so you can see which types work for your audience rather than the platform average. To watch this ranking move over time, the MagicPost Benchmark rebuilds it on fresh data and sends you the update each month.
Which post types get the most engagement (and which to skip)
The table is not a command to only post about wins. A feed of nothing but victories reads like a highlight reel nobody believes. It is a guide to your mix.
Mostly give. Make the bulk of your posting the high-rate, first-person types: a win, a lesson, a challenge you came through, a candid situation recap. These are what the algorithm and the audience both reward, and they are the ones only you can write.
Occasionally ask. Promotion is allowed; the data just says keep it the minority. Nobody at 0.31% built an audience, but everybody has a webinar to fill sometimes.
When you ask, wrap it in a win or a lesson. This is the move the table is begging for. Do not publish a bare "sign up for my webinar" (0.31%). Publish the lesson you will teach there, the hard moment that made you build it, and let the signup ride on the back of a post people actually wanted to read. You borrow the top of the table to carry the bottom.
Use the listicle for reach, deliberately. When you want comments and saves rather than rate, a tips/rules list earns the highest median comments in the data (23). Slot one in when you need the conversation, not as your daily bread.
If the hard part is never running out of types to rotate through, that is a generation problem, and MagicPost's post ideas fits this intent perfectly: it keeps a fresh queue of angles so you are never staring at "win, lesson, or launch?" with nothing in the tank.
Where this data comes from
These numbers are MagicPost's own, built from a core pool of 1,141,932 LinkedIn posts published over the last 12 months by individual creators (company and topic pages left out, authors under 100 followers left out), reshares and deleted posts filtered. Engagement rate is computed per post as (likes + comments) divided by the author's follower count, then summarized as the median per type. Median over mean, so one viral post cannot swing a type's number. Content types are assigned by MagicPost's classifier on the post text; a post can blend types and the classifier picks the dominant one; we report only types with at least 3,000 posts (22 of them). Median likes and median comments sit next to every rate precisely because account size hides inside the rate, and the three columns together keep any single number from misleading.
Perguntas Frequentes
Qual tipo de post do LinkedIn gera mais engajamento?
Celebrating a win, by a clear margin. Across 23,877 such posts it earns a 1.21% median engagement rate versus the author's followers, with 66 median likes and 11 median comments, roughly three times the 0.39% platform median. The rest of the podium is also lived experience: challenges overcome (1.03%) and a hard moment you are going through (0.80%). The lowest-engagement types are all promotional asks: podcast or video shares (0.29%), webinar signup pushes (0.31%) and value-first selling (0.33%). The pattern is consistent across all 22 types we measured: posts that give an emotion or an insight beat posts that ask the reader to do something for you, by about four to one.
What is the difference between a post type and a post format?
A type is what the content is about and is trying to do (a win, a lesson, a launch, a contrarian take). A format is the medium it is delivered in (image, video, carousel, text, poll). They are independent: you can post a "lessons learned" type as a video or as plain text. This page ranks types; for the medium, see the best LinkedIn post format and engagement rate by post format.
Do promotional LinkedIn posts really get less engagement?
Yes, measurably. The three lowest types in our ranking are all promotional: podcast / video share (0.29%), webinar signup push (0.31%) and value-first selling (0.33%), versus 1.21% for celebrating a win. Launch announcements do better (0.43%) because a launch reads as a milestone rather than an ad. The fix is not to stop promoting but to wrap the ask inside a win or a lesson, so the post earns attention before it requests action.
Why does "useful resources" have high likes but a low engagement rate?
Account size. The "useful resources" type carries 51 median likes (up with the top performers) but only a 0.42% median engagement rate, because bigger accounts post it more often. A bigger account collects more raw likes while its rate is diluted by a large follower count in the denominator. That is why every row shows the rate, the median likes and the sample size together: read the likes alone and you would rank this type far too high. The same size effect runs through every cut of LinkedIn data.
How were these post types classified?
By MagicPost's content classifier, which reads each post's text and assigns the dominant type. It is not author-declared, so a post that blends a lesson with a soft pitch gets labeled by whichever intent dominates. We keep only types backed by at least 3,000 posts (22 in total) so every median is stable, and we report medians rather than averages so no viral post can bend a type's number.
> Stop guessing what to post. MagicPost covers the drafting, the scheduling and the analytics, so your energy goes into living the wins and lessons worth sharing rather than second-guessing the algorithm.

Average Engagement Rate on LinkedIn: 0.39% (2026 Data)
What is the average engagement rate on LinkedIn? 0.39% vs followers, 2.63% vs impressions, on 1.1M posts. Full ladders by follower count.

How Many Impressions Does a LinkedIn Post Get? 788
How many impressions does a LinkedIn post get? The median is 788 (539,310 posts measured): p25 307, p75 2,236, p90 6,825. The full spread.

O que é uma boa taxa de engajamento no LinkedIn? (2026)
Qual é uma boa taxa de engajamento no LinkedIn? O p75 da sua faixa de tamanho: 3,43% para menos de 1 mil seguidores, 0,66% para 10 mil a 50 mil (em relação aos seguidores); acima de 4% dos visualizadores em qualquer lugar.

How Many Likes Is Good on LinkedIn? The Median Is 28
How many likes is good on LinkedIn? The median post gets 28 (1.1M posts measured). Good for your size: 15 under 1k followers, 695 at 100k+.

Quantos comentários é um bom número no LinkedIn? O post médio recebe 6 (1,1 milhão de posts medidos)
Quantos comentários é considerado bom no LinkedIn? A mediana por publicação é de 6 (1,1 milhão de publicações) e um quarto recebe no máximo 1. Bom para o seu tamanho: 4 para menos de 1 mil, 114 para mais de 100 mil.

LinkedIn Engagement Rate by Topic: 44 Topics Ranked
LinkedIn engagement rate by topic, on 1.1M posts: graphic design leads at 1.16%; AI (0.24%) and HR (0.21%) sit at the bottom. 44 topics ranked.

LinkedIn Engagement Rate by Country: 21 Ranked (2026)
LinkedIn engagement rate by country: Pakistan (1.16%) and Nigeria (1.14%) lead, France 0.49%, the US 0.26%. 21 countries measured on 1.1M posts.

LinkedIn Engagement Rate by Post Format, Ranked (2026)
LinkedIn engagement rate by post format: images convert 3.10% of viewers, video 2.68%, carousels 2.48%, polls 0.62%. Measured on 497,946 posts.

Quantas impressões são boas no LinkedIn?
Quantas impressões são boas no LinkedIn? Aqui está a resposta.

The Best LinkedIn Post Format in 2026 (1.2M Posts)
The best LinkedIn post format in 2026, measured on 1.2M posts: image and carousel lead at 34 median likes, video is rising, polls are last. Full data.