" height="26.80529977783203px" id="tymKb8bqC" width="128.00300311279295px"/><path d="M 0 2.417 L 0 0 L 12.909 0 L 12.909 2.417 Z" fill="rgb(126, 78, 253)" height="2.417099999999998px" id="aYr4em6zK" transform="translate(128.341 22.325)" width="12.908999999999992px"/></svg>)
"/><stop offset="1" stop-color="rgb(118, 37, 250)"/></linearGradient></defs><g d="M 19.242 21.22 L 19.362 6.204 L 19.272 6.204 L 13.757 21.22 L 10.161 21.22 L 4.796 6.204 L 4.706 6.204 L 4.825 21.22 L 0 21.22 L 0 0 L 7.283 0 L 12.109 13.607 L 12.229 13.607 L 16.844 0 L 24.247 0 L 24.247 21.22 Z M 26.421 26.113 L 26.421 23.445 L 41.407 23.445 L 41.407 26.113 Z" fill="transparent" height="26.112508199679183px" id="DvfaAIHYn" width="41.40731898311435px"><path d="M 19.242 21.22 L 19.362 6.204 L 19.272 6.204 L 13.757 21.22 L 10.161 21.22 L 4.796 6.204 L 4.706 6.204 L 4.825 21.22 L 0 21.22 L 0 0 L 7.283 0 L 12.109 13.607 L 12.229 13.607 L 16.844 0 L 24.247 0 L 24.247 21.22 Z" fill="rgb(46, 46, 46)" height="21.220180016149442px" id="pLsxRCobd" width="24.247352589074694px"/><path d="M 0 2.668 L 0 0 L 14.986 0 L 14.986 2.668 Z" fill="url(%23yD9d4I5GR-3279285344-linear-gradient)" height="2.6675085048549647px" id="yD9d4I5GR" transform="translate(26.421 23.445)" width="14.986002836263765px"/></g></svg>)

Naïlé Titah
If you searched for the LinkedIn engagement rate by industry, you were probably hoping for a table that says "SaaS marketers earn X%, recruiters earn Y%." We have something more precise, and one honest caveat that makes it more useful than the recycled reports you were reading.
Here is the caveat first, because it changes how you read everything below. Our data classifies what a post is about, not what industry its author works in. A recruiter posting a personal story about burnout is filed under Personal Development, not Human Resources. So this is engagement rate by topic of the post, which is the thing you actually control when you sit down to write. The "industry" your search engine matched is a property of you; the topic is a property of each post, and that is the lever.
We measured it across 44 topics drawn from individual creators over the last 12 months. Each post's engagement rate was computed one at a time, then we took the median per topic so a single viral outlier does not swing a row. Engagement rate here is (likes plus comments) divided by the author's follower count.
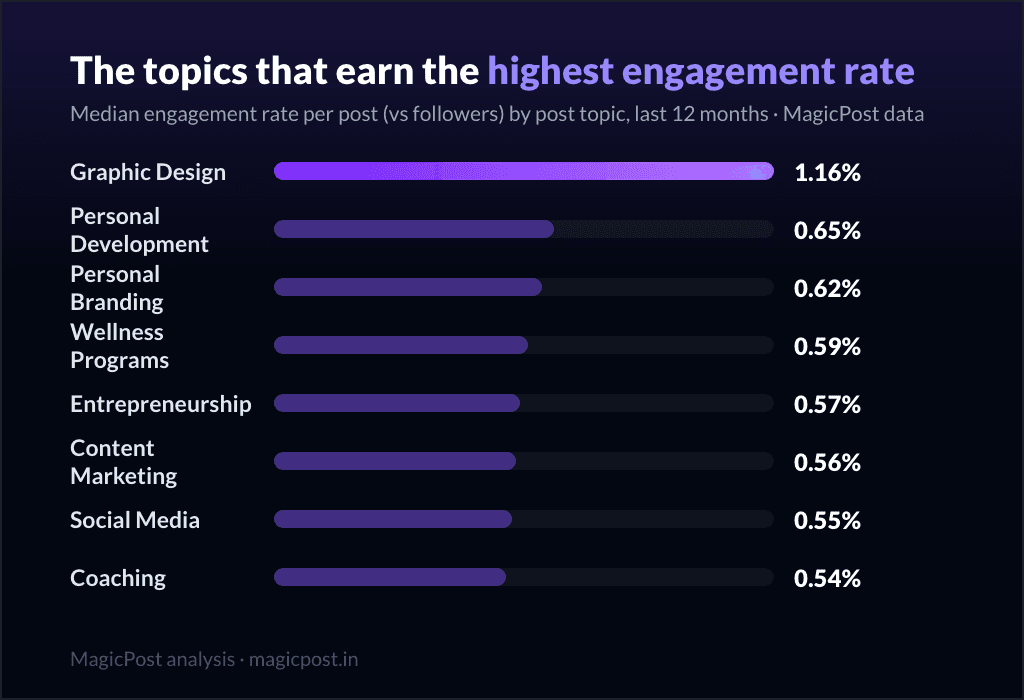
TL;DR: Graphic design tops LinkedIn topics with a 1.16% median engagement rate; posts about AI (0.24%) and HR (0.21%) sit at the bottom of 44 topics ranked. The most-discussed subject on LinkedIn earns one of its worst engagement rates.
The headline: the most-discussed topic earns one of the worst rates
Graphic Design tops the table at 1.16%, roughly double the next topic. At the very bottom sit two of the topics LinkedIn talks about most: AI at 0.24% (second to last) and Human Resources at 0.21% (dead last). Posts about AI are written by the platform in industrial volume (41,127 posts in our pool, more than almost any other topic) and they earn one of the lowest engagement rates we measured.
That is a saturation story. The most crowded conversation is the hardest one to get heard in: when everyone posts about the same subject, the median post competes against a wall of identical posts, and the median reader has already scrolled past nine of them today.
This is a distinct finding from the one about AI-sounding writing, where posts that read as machine-generated underperform regardless of subject. That second effect is covered in why AI-sounding posts get less engagement; here the point is narrower and about the topic itself. Both push the same direction, for different reasons.


Every topic, ranked by engagement rate vs followers
Find your subject, not the top of the table. The rate column is the median engagement rate versus followers; median likes and the number of posts measured sit beside it precisely because account size hides inside every topic (more on that below the table).
Topic | Median ER (vs followers) | Median likes | Posts measured |
Graphic Design | 1.16% | 33 | 3,956 |
Personal Development | 0.65% | 66 | 10,900 |
Personal Branding | 0.62% | 67 | 6,748 |
Wellness Programs | 0.59% | 32 | 9,556 |
Entrepreneurship | 0.57% | 41 | 34,067 |
Content Marketing | 0.56% | 34 | 113,731 |
Social Media | 0.55% | 46 | 19,315 |
Coaching | 0.54% | 24 | 25,358 |
Networking | 0.53% | 38 | 4,053 |
Education | 0.51% | 27 | 18,199 |
Brand Management | 0.51% | 26 | 3,327 |
Work Culture | 0.51% | 71 | 6,393 |
Event Management | 0.51% | 34 | 4,548 |
Social Entrepreneurship | 0.48% | 49 | 4,583 |
Software Development | 0.48% | 23 | 16,430 |
Environmental Science | 0.46% | 36 | 4,387 |
Marketing | 0.44% | 31 | 50,472 |
Healthcare | 0.44% | 29 | 19,257 |
Construction | 0.44% | 18 | 3,420 |
Law | 0.44% | 23 | 4,448 |
Customer Experience | 0.44% | 17 | 3,960 |
Psychology | 0.44% | 39 | 26,409 |
E-commerce | 0.42% | 15 | 3,154 |
Customer Service | 0.39% | 20 | 10,196 |
Leadership | 0.39% | 40 | 68,154 |
Data Science | 0.38% | 28 | 16,248 |
Management | 0.38% | 24 | 32,229 |
Business Development (BD) | 0.37% | 29 | 14,372 |
Human-Centered Design | 0.36% | 37 | 6,112 |
Cloud Computing | 0.36% | 24 | 3,408 |
Communication | 0.35% | 48 | 4,457 |
Product Management | 0.35% | 24 | 3,862 |
Accounting | 0.34% | 18 | 3,359 |
Sales | 0.32% | 33 | 34,237 |
Public Policy | 0.32% | 38 | 6,517 |
0.32% | 23 | 3,225 | |
Business Analysis | 0.31% | 19 | 4,751 |
Cybersecurity | 0.29% | 27 | 12,485 |
Finance | 0.28% | 19 | 29,563 |
HR | 0.28% | 31 | 12,560 |
Real Estate | 0.24% | 12 | 7,388 |
Career Development | 0.24% | 50 | 13,416 |
AI | 0.24% | 42 | 41,127 |
Human Resources | 0.21% | 24 | 4,567 |
Why the rate ranking and the likes ranking disagree
Read down the median-likes column and you will notice it does not march in step with the rate column. That mismatch is the most important thing on this page, so here is the mechanism in plain terms.
Engagement rate versus followers falls mechanically as accounts get bigger. The denominator is the follower count, and a 100k-follower account would need 100 times the likes of a 1k account just to post the same rate, which never happens because reach does not scale with followers. So any topic written about disproportionately by large accounts shows a lower engagement rate, not because the content is worse, but because the arithmetic divides by a bigger number. This is the same size effect spelled out in the pillar on average engagement rate, where the median rate vs followers drops from 1.39% under 1k followers to 0.13% above 100k.
That is exactly why every row above carries median likes and a post count, and the disagreements are easy to spot:
Career Development sits near the very bottom on rate (0.24%) yet posts a median of 50 likes, more than Graphic Design's 33 at the top of the table. The rate is low because career content is written by larger, more established accounts; the raw reach is fine.
AI lands second-to-last at 0.24% but earns 42 median likes, again above the topic that leads on rate. A typical AI post collects more likes than a typical graphic-design post; it just collects them against a far bigger follower base.
Work Culture carries the highest median likes in the table at 71, while ranking only mid-pack on rate (0.51%). High absolute reach, average efficiency.
The opposite case exists too: Graphic Design wins on rate (1.16%) with a modest 33 median likes, which is the signature of a topic posted mostly by smaller accounts whose every post lands hard against a tight follower base. Neither ranking is "the truth." Rate tells you efficiency for your size; likes tell you raw reach. Judge a topic on both, and never on rate alone.
Where do you stand on these numbers? MagicPost's LinkedIn analytics compute your engagement rate per post against your own followers and your own history, so you can see how your topics perform for your account instead of an internet median. For a monthly pulse on the wider field, the MagicPost Benchmark recomputes this table on fresh data and mails it to you.
Personal topics beat corporate topics
Strip out the size confounder (the same one that reshuffles the engagement rate by post format ranking) by looking at where each kind of topic clusters, and a pattern survives. The personal and human subjects sit at the top: Personal Development (0.65%), Personal Branding (0.62%), Wellness Programs (0.59%) and Networking (0.53%) all clear half a percent. The corporate and functional subjects sink to the bottom: Finance (0.28%), HR (0.28%), Cybersecurity (0.29%), Business Analysis (0.31%) and Human Resources (0.21%).
The split is not perfect, and the exceptions are instructive. Graphic Design tops the whole table despite being a craft topic, not a personal one, which is the smaller-accounts effect doing its work. Leadership, a perennial favorite, lands a middling 0.39% on 68,154 posts, the second-largest pool here, because it is written about by everyone at every size. But the direction is consistent with the content-type cut, where lived experience outperforms promotion by a wide margin: subjects close to a human story (development, branding, wellness) earn engagement; subjects that read like a department (finance, HR, analysis) earn less of it.
If you are weighing what to write next inside your field, that is the actionable read: anchor the post in a person and an experience rather than a function, even when the underlying subject is corporate. (Stuck for the actual idea? LinkedIn post ideas helps you find what to post within your own topic.)
Which LinkedIn topics should you actually post about?
Find your topic's row, then read both columns. A low rate on a high-likes topic (Career Development, AI) means the subject earns real reach against big accounts; do not read it as "avoid this topic."
If your subject is saturated, the rate is your warning, not the content. AI and HR are the crowded rooms; you need a sharper angle to clear the median, not a different subject.
Borrow the high-rate framing even for corporate subjects. The top of the table is personal, human and specific. Write finance as a person's story, not a function's update.
Compare against your own size band, always. These are cross-account medians; a topic's rate moves with the accounts that post it, so your real comparison is your own history, not this table.
One place for the whole LinkedIn workflow. MagicPost drafts the post, queues it, and reads back the analytics, which leaves you free to pick the topic worth writing about.
Where this data comes from
These numbers come from MagicPost's own data, not a survey or a scraped report. The pool is LinkedIn posts from the last 12 months by individual creators (company and topic pages left out, authors under 100 followers left out), with reshares and deleted posts filtered. Each post was assigned a single topic describing what the post is about, read from its text, which is why we call it a topic and not an industry: it is a property of the post, not the author's job. Engagement rate is computed per post as (likes + comments) divided by the author's follower count, and we report the median per topic. We take the median rather than the mean on purpose, so one runaway viral post moves nothing. The 44 topics shown each cleared a minimum sample (the smallest, LinkedIn, rests on 3,225 posts; the largest, Content Marketing, on 113,731). Median likes accompany every rate to expose the account-size confounder, since engagement rate vs followers falls mechanically as accounts grow.
FAQ
Which topics get the most engagement on LinkedIn?
Measured across 44 topics over the last 12 months, Graphic Design earns the highest median engagement rate at 1.16% versus the author's followers, followed by Personal Development (0.65%) and Personal Branding (0.62%). Personal and human subjects cluster at the top. The lowest are Human Resources (0.21%), AI (0.24%) and Career Development (0.24%). But low rate does not always mean low reach: AI and Career Development both earn high median likes (42 and 50), so they are written about by larger accounts whose follower count divides the rate down. Read rate and likes together.
Why does AI get such a low engagement rate if everyone posts about it?
Because everyone posts about it. AI is one of the most-written subjects in our pool (41,127 posts) and earns a median engagement rate of just 0.24% vs followers, second to last. That is a saturation effect: the median AI post competes against a wall of near-identical posts. It is separate from the finding that AI-sounding writing underperforms regardless of topic, covered in why AI-sounding posts get less engagement. Note that AI posts still earn a healthy 42 median likes, so the reach is there; the rate is low mostly because the accounts writing about AI are large.
Is this LinkedIn engagement rate by industry or by topic?
By topic of the post, which is the more precise and more useful version of what "by industry" searchers usually want. Our data classifies what each post is about (its subject), not the industry the author works in. A consultant writing a personal-growth story counts as Personal Development, not as their employer's industry. Topic is the lever you control when you write; industry is a fixed property of you. So the table tells you which subjects earn engagement, which is the question that actually changes your next post.
Do these topic numbers account for account size?
Not on their own, and that is deliberate. Engagement rate vs followers falls mechanically as accounts grow, so a topic written about mostly by large accounts (AI, Career Development, Leadership) shows a lower rate without the content being worse. That is why every row carries median likes and a post count beside the rate: the two columns disagree often (Career Development: 0.24% rate but 50 median likes), and the disagreement is the size confounder showing through. For a fair read, compare against your own follower band using the pillar's size ladders, not this cross-account table.
How does engagement by topic compare to engagement by country or post type?
Topic is one of several cuts of the same underlying metric. Engagement rate also varies by the author's country (Pakistan and Nigeria lead the world) and by the type of post (lived experience beats promotion). The same size caveat applies to all of them: each cut carries median likes and sample size because account size hides inside every grouping. Start from the pillar on average engagement rate for the full picture.
</content>
</invoke>

LinkedIn Engagement Rate by Country: 21 Ranked (2026)
LinkedIn engagement rate by country: Pakistan (1.16%) and Nigeria (1.14%) lead, France 0.49%, the US 0.26%. 21 countries measured on 1.1M posts.

LinkedIn Engagement Rate by Post Format, Ranked (2026)
LinkedIn engagement rate by post format: images convert 3.10% of viewers, video 2.68%, carousels 2.48%, polls 0.62%. Measured on 497,946 posts.

Which LinkedIn Post Type Gets the Most Engagement?
Which LinkedIn post types get the most engagement? Celebrating a win leads at 1.21%; podcast shares and webinar pushes trail at 0.29-0.31%. 22 types ranked.

Average Engagement Rate on LinkedIn: 0.39% (2026 Data)
What is the average engagement rate on LinkedIn? 0.39% vs followers, 2.63% vs impressions, on 1.1M posts. Full ladders by follower count.

How Many Impressions Does a LinkedIn Post Get? 788
How many impressions does a LinkedIn post get? The median is 788 (539,310 posts measured): p25 307, p75 2,236, p90 6,825. The full spread.

What Is a Good Engagement Rate on LinkedIn? (2026)
What is a good engagement rate on LinkedIn? Your size band's p75: 3.43% under 1k followers, 0.66% at 10k-50k (vs followers); above 4% of viewers anywhere.

How Many Likes Is Good on LinkedIn? The Median Is 28
How many likes is good on LinkedIn? The median post gets 28 (1.1M posts measured). Good for your size: 15 under 1k followers, 695 at 100k+.

How Many Comments Is Good on LinkedIn? The Median Is 6
How many comments is good on LinkedIn? The median post gets 6 (1.1M posts) and a quarter get at most 1. Good for your size: 4 under 1k, 114 at 100k+.

How Many Impressions Are Good on LinkedIn? By Size
How many impressions are good on LinkedIn? It depends on your size: 225 median under 1k followers, 12,111 at 100k+. The full ladder, measured.

The Best LinkedIn Post Format in 2026 (1.2M Posts)
The best LinkedIn post format in 2026, measured on 1.2M posts: image and carousel lead at 34 median likes, video is rising, polls are last. Full data.