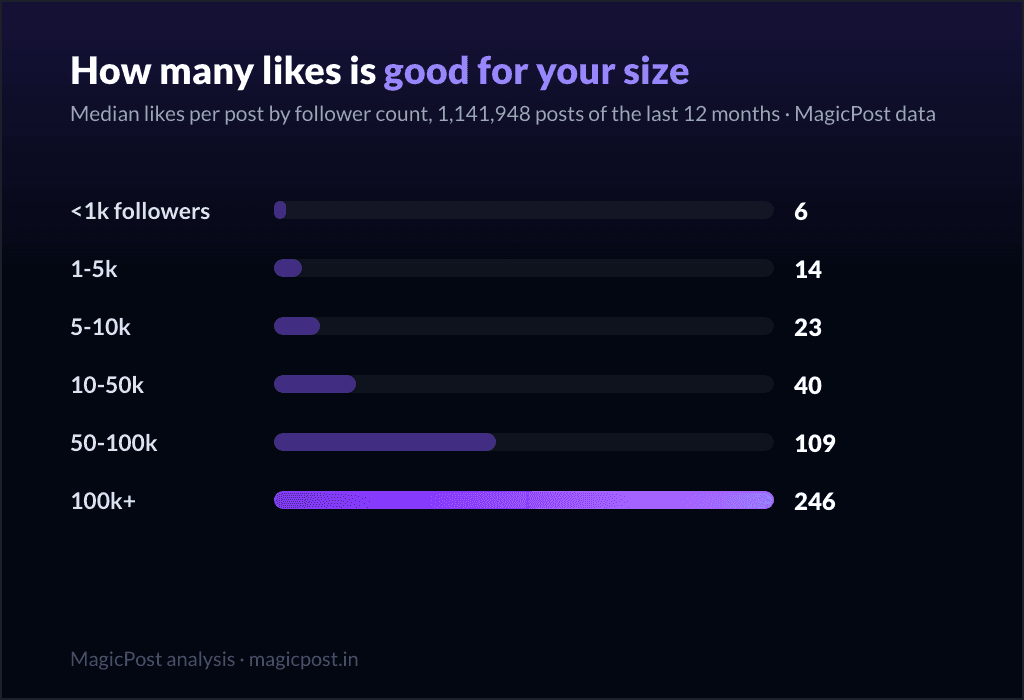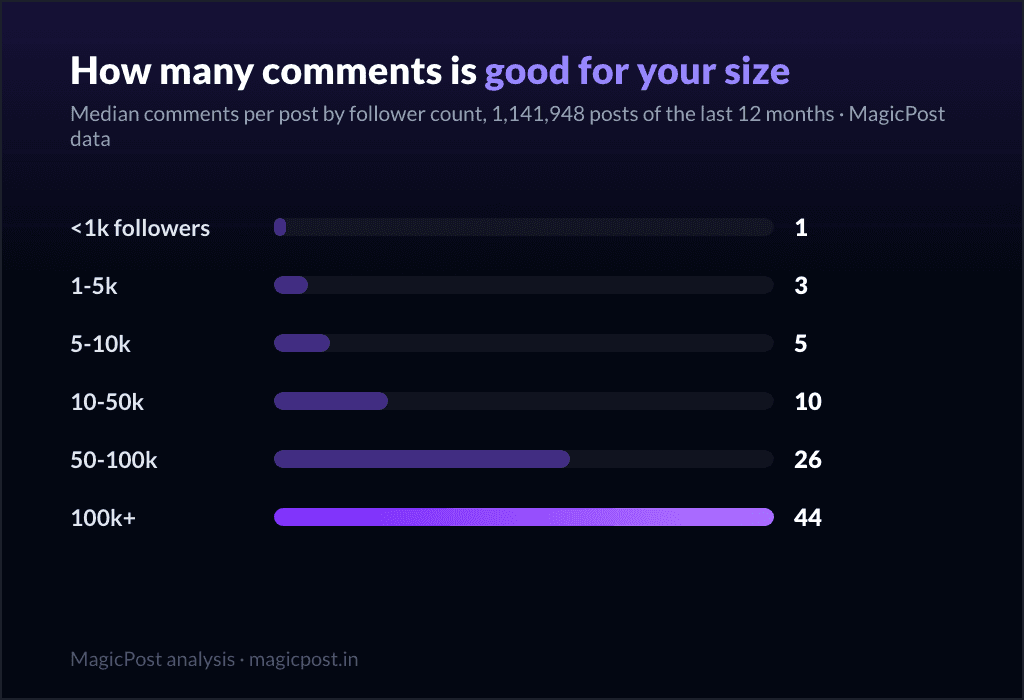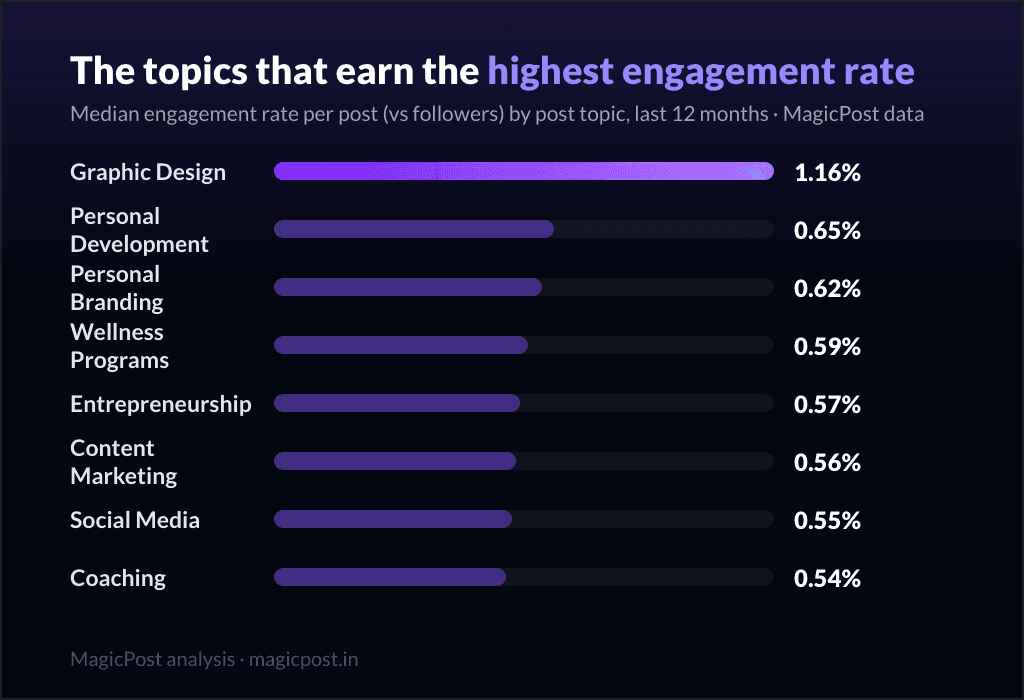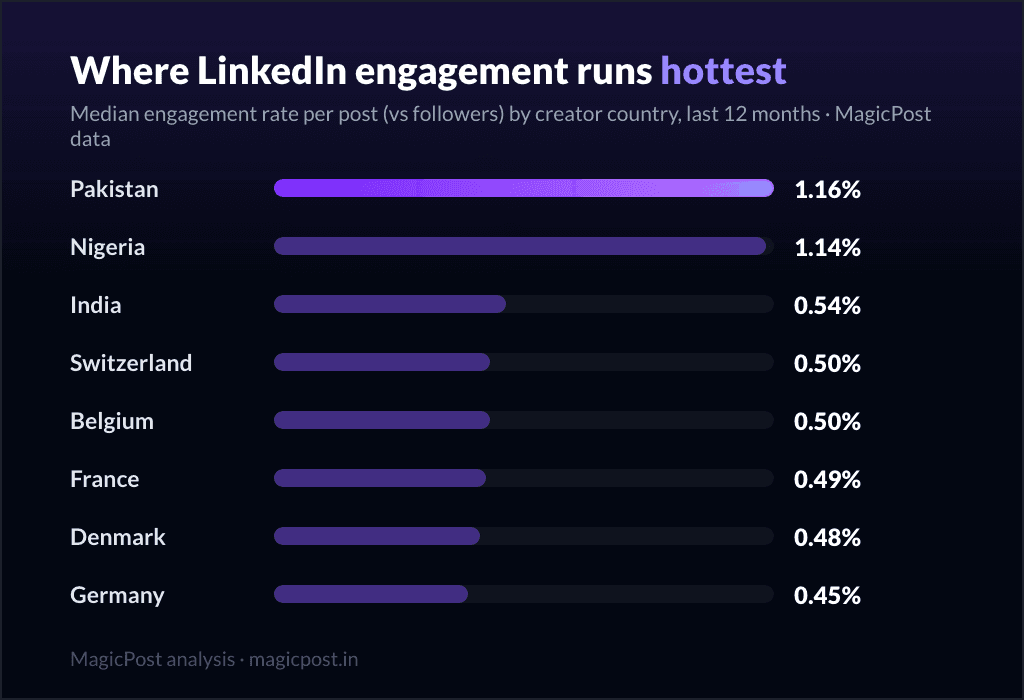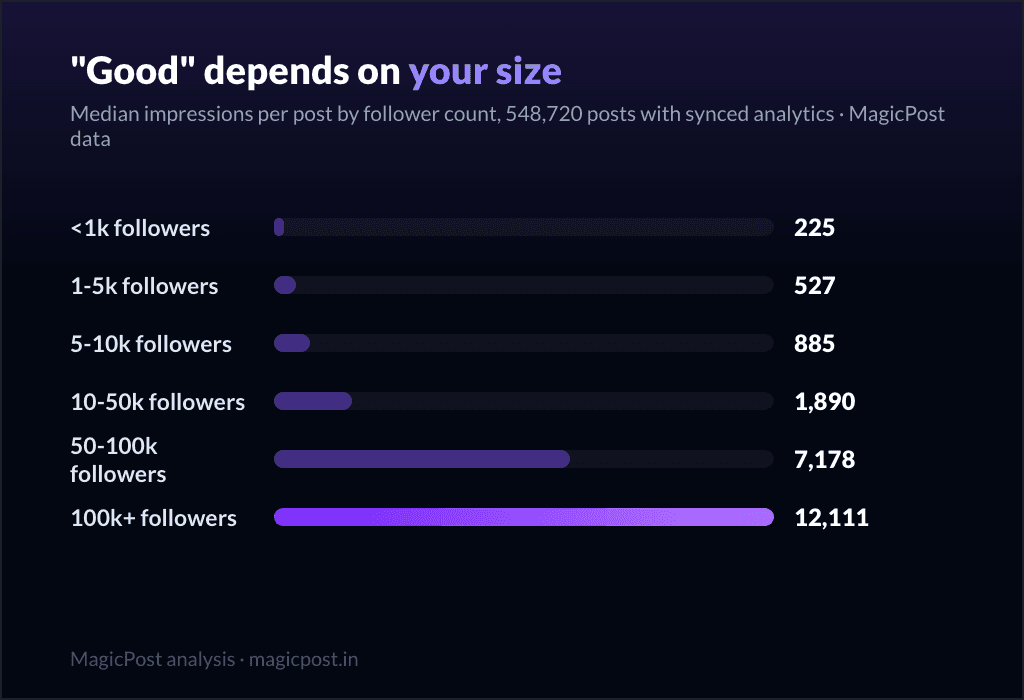
A good engagement rate on LinkedIn is your size band's 75th percentile: roughly 3.43% under 1,000 followers, 1.72% at 1k-5k, 0.99% at 5k-10k, 0.66% at 10k-50k, 0.51% at 50k-100k and 0.32% above 100k, all measured against followers. That is the one-line answer, and the rest of this page is why those six numbers are so different from each other, and why nearly every "a good engagement rate is X%" article you have read is quietly comparing you to the wrong people.
If you want the typical number instead of the good one, the average version of this question lives in the pillar: what is the average engagement rate on LinkedIn. This page is about the bar one notch higher: not "am I normal?" but "am I good?"
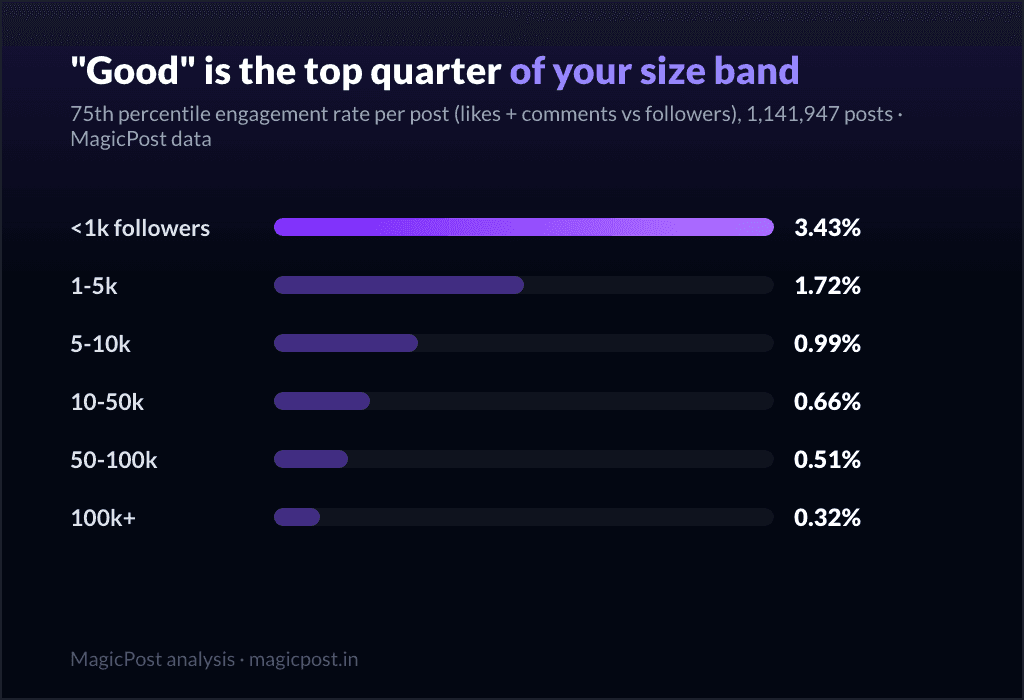
These come from 1,141,932 LinkedIn posts across the last 12 months, each rate worked out on its own post and reported as percentiles, which keeps one viral post from lifting a whole row.
First, decide which "engagement rate" you mean
Engagement rate is (likes + comments) on a post, divided by something, and the entire confusion on this topic comes from that "something". There are two defensible denominators and they are not comparable:
Versus followers. Divide by your follower count. This is the public, quotable version, because anyone can see your follower number. It punishes growth: every follower who never sees your post still sits in the denominator.
Versus impressions. Divide by how many people actually saw the post. This is the version that judges your content, because it only counts the audience you really reached. It needs analytics access, which is why public studies almost never use it.
Across our whole pool, the median post earns 0.39% versus followers and 2.63% versus impressions (the second on 501,303 posts with synced analytics). Same posts, same likes, same comments: the rate is nearly seven times bigger just from changing the denominator. So "good" means nothing until you fix which one you are talking about. Every table below says so explicitly.
The "2% rule", treated with the respect it half-deserves
You have probably heard that 2% is a good LinkedIn engagement rate. It is not wrong. It is just unlabelled, and the missing label is the whole problem.
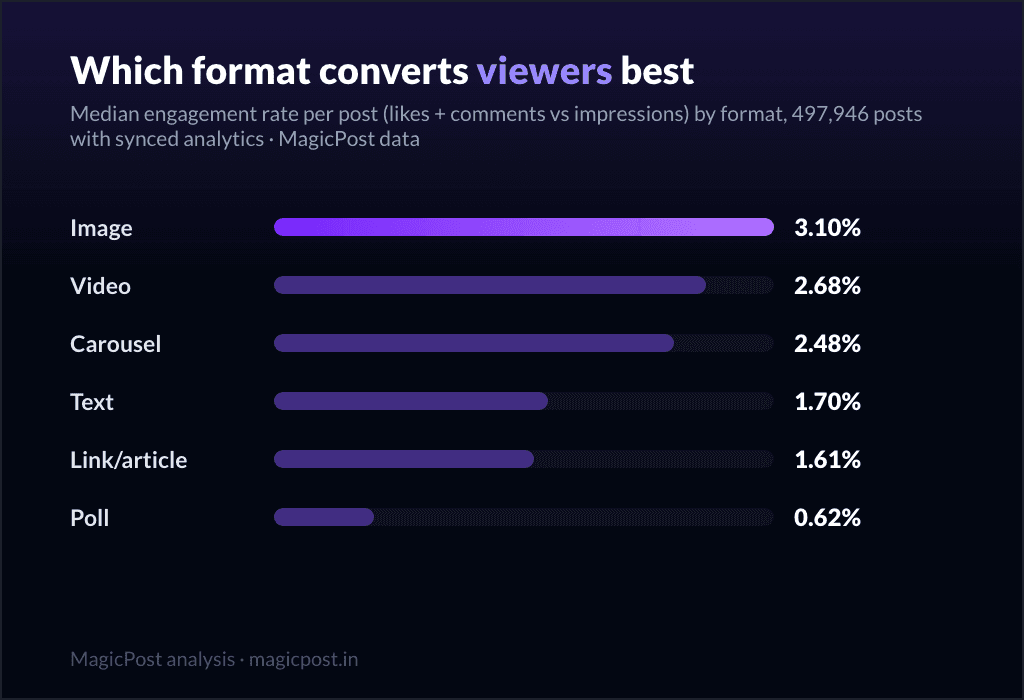
Divide by impressions, and 2% is roughly right. The median post converts 2.63% of the people who saw it. So "a good post engages about 2 in 100 viewers" is a fair, if conservative, rule of thumb. (Genuinely good is higher, around 4% or more, but as a floor it holds.)
Divide by followers, and 2% is badly wrong above 5,000 followers. The median there is 0.39%. A 2% engagement rate versus followers would be a career-best post for almost anyone past a few thousand followers, not a baseline to clear.
The people quoting "2%" almost never tell you which denominator they used, and most of them do not know. That single omission is why one creator thinks they are failing at 0.5% and another thinks they are crushing it at 0.5%, when context, not effort, is the difference. Resolving that confusion is the entire job of this page.
The full ladder: engagement rate vs followers, by size
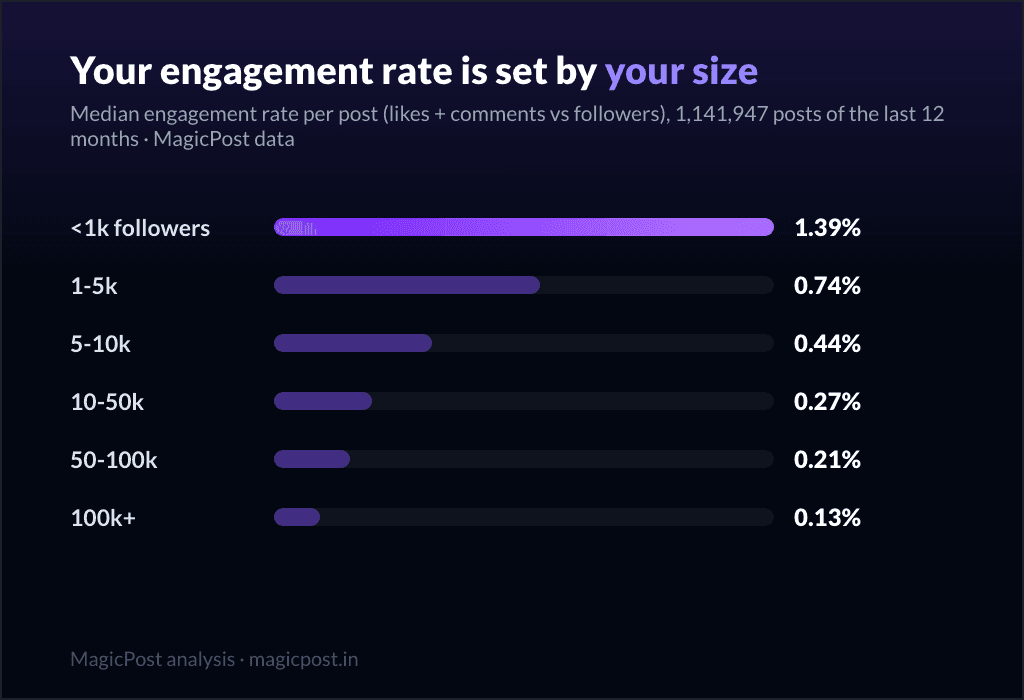
Here is the table the "2%" advice never shows. Read your row, ignore the rest. This table divides by followers.
Followers | Quiet (p25) | Typical (p50) | Good (p75) | Great (p90) | Posts measured |
Under 1k | 0.46% | 1.39% | 3.43% | 7.25% | 81,060 |
1k-5k | 0.28% | 0.74% | 1.72% | 3.51% | 337,945 |
5k-10k | 0.17% | 0.44% | 0.99% | 2.01% | 182,219 |
10k-50k | 0.10% | 0.27% | 0.66% | 1.39% | 329,126 |
50k-100k | 0.09% | 0.21% | 0.51% | 1.03% | 75,353 |
100k+ | 0.05% | 0.13% | 0.32% | 0.67% | 136,244 |
Four columns, four labels:
Quiet (p25): a quarter of posts land below this. A slow day.
Typical (p50): the median post for that size. Exactly normal, not good.
Good (p75): the bar this page is about. Beat your typical number by this much and you are in the top quarter for your size.
Great (p90): the top 10%. A standout post, not a baseline. Aim here and you will feel like a failure 90% of the time.
The "good" column is the one to internalise, and notice how it collapses: a great day for a 100k account (0.67%) is quieter than a slow day for an account under 1k (whose quiet p25 sits at 0.46%, near it).
They are not better or worse creators. They are on different rungs of the same ladder, and a flat "good = 2%" rule would tell five of these six bands they are failing.
Measured against views, "good" is the same everywhere
Now recompute the exact same metric against impressions, on the 501,303 posts with synced analytics, and the ten-fold spread almost vanishes. This table divides by impressions.
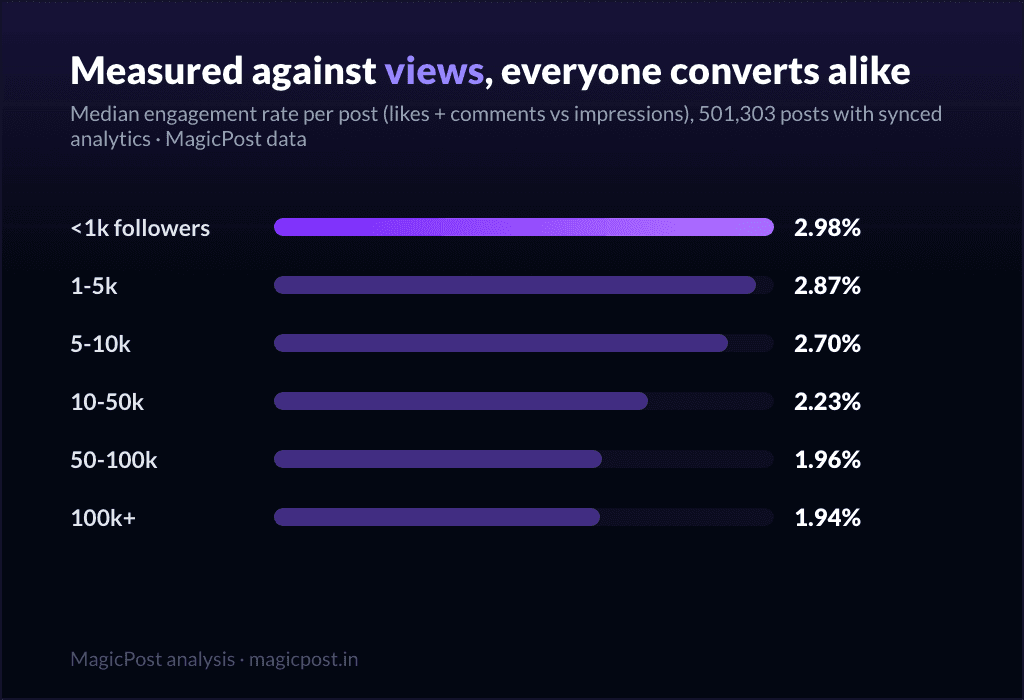
Followers | Typical (p50) | Good (p75) | Posts measured |
Under 1k | 2.98% | 4.99% | 43,593 |
1k-5k | 2.87% | 4.85% | 200,939 |
5k-10k | 2.70% | 4.75% | 98,139 |
10k-50k | 2.23% | 4.05% | 135,295 |
50k-100k | 1.96% | 4.09% | 13,541 |
100k+ | 1.94% | 3.64% | 9,796 |
The "good" column here barely moves: a good post gets above roughly 4% of its viewers to engage at almost any size (4.99% under 1k, down to 3.64% at 100k+). This is the closest thing LinkedIn has to a universal pass mark. If your posts clear ~4% of viewers, your writing is good, full stop, whatever your follower count says.
That contrast is the most useful thing on this page. The versus-followers ladder spans more than ten to one because it is mostly a reach story; the versus-impressions ladder is nearly flat because it is a content story, and good content converts viewers at a similar clip regardless of how big you are.
Which rung are you actually on? MagicPost's LinkedIn analytics compute your engagement rate per post, both ways, against your own history, so "good for my size" stops being a guess. And if you'd rather not rebuild these ladders on fresh data each quarter, a MagicPost Benchmark subscription mails you the recomputed version every month.
"Good" is a moving target. Aim p75, not p90
Two cautions before you screenshot a number and frame it.
Aim for "good" (p75), not "great" (p90). Good is repeatable: a quarter of your posts can realistically clear it if your content is solid. Great is a tail event by definition.
Ten percent of posts hit p90, often the ones that caught a lucky reshare or a timely topic, and you cannot will that on demand. Set p75 as the target you expect to meet most months, and treat any p90 day as a bonus, not the standard you have failed to maintain.
Re-aim quarterly. Every number here is a 12-month median on a platform that keeps shifting. As your follower count climbs into the next band, your "good" bar versus followers drops to that band's p75, and the bar that felt good last year may be merely typical now (or vice versa). The ladders themselves move too, so treat "good" as a number you reset every quarter, not a lifetime trophy.
You are below typical. Which lever do you pull?
If you sit under the typical column for your size, the fix depends on which definition is sagging, and this is where the two denominators finally earn their keep:
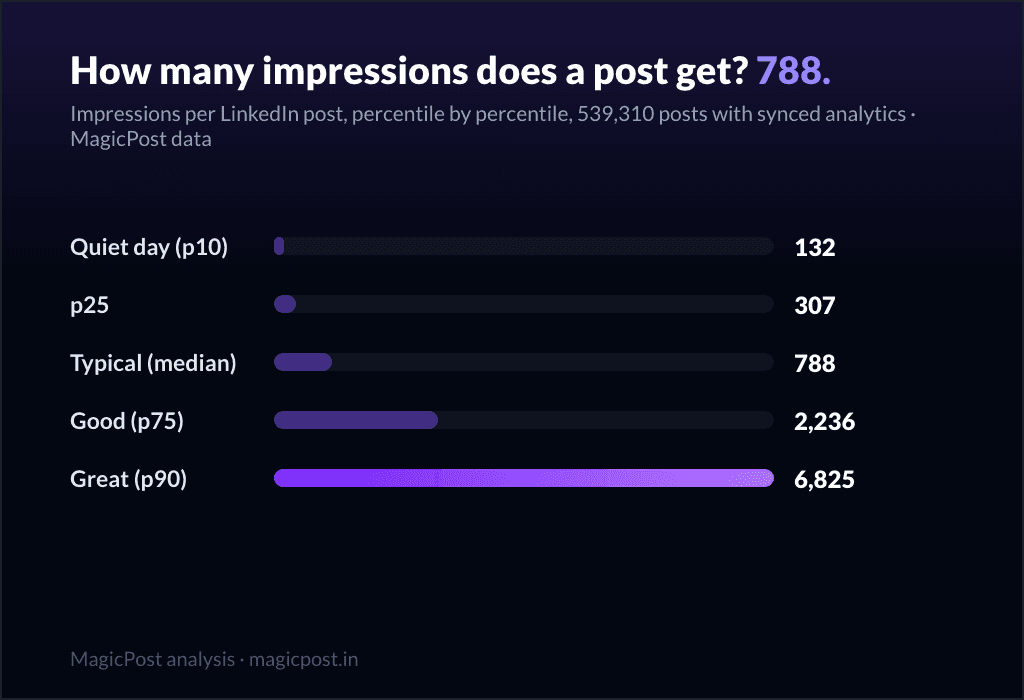
Versus impressions is healthy, versus followers is low. Your content is fine. The people who see you engage at a good rate; there just are not enough of them. This is a reach problem, not a writing problem. Start by learning what a normal reach even looks like (how many impressions does a LinkedIn post get), then work on distribution using the ladder to aim for in how many impressions are good on LinkedIn.
Versus impressions is also low. Now it is a content problem. People are seeing the post and scrolling past. That is the rate to fix first, because reach without engaging content just spends your distribution faster.
And if you want to break "engagement" into its two parts to see which is dragging, likes and comments each have their own size ladders: how many likes is good on LinkedIn and how many comments is good on LinkedIn. Comments are the scarcer, stronger signal, so a post that is good on likes but quiet on comments is engaging skimmers, not converting readers.
Writing, scheduling and analytics under one roof. MagicPost runs the whole LinkedIn routine, so the only thing left to make is the post worth measuring.
Where this data comes from
These engagement-rate figures are MagicPost's own, start to finish. Core pool: 1,141,932 LinkedIn posts published over the last 12 months by individual creators (company and topic pages excluded, authors under 100 followers excluded), reshares and deleted posts filtered out. Engagement rate is computed per post as (likes + comments) divided by the author's follower count, or by the post's impressions where synced analytics exist (501,303 posts, aggregated and anonymized, n stated on every impressions claim). Rows are percentiles rather than averages, so no small cluster of viral posts can pull a band up, and the two denominators are published apart because they answer different questions and never line up on the same scale.
FAQ
What is a good engagement rate on LinkedIn?
A good engagement rate is your size band's 75th percentile. Measured against followers, on 1,141,932 posts from the last 12 months: 3.43% under 1k followers, 1.72% at 1k-5k, 0.99% at 5k-10k, 0.66% at 10k-50k, 0.51% at 50k-100k and 0.32% above 100k. Measured against impressions instead (501,303 posts with synced analytics), a good post engages above roughly 4% of its viewers at almost any size (4.99% under 1k down to 3.64% at 100k+). Always check which denominator a quoted figure uses, because the two are not comparable.
Is 2% a good engagement rate on LinkedIn?
It depends entirely on the denominator. Divide by impressions and 2% is roughly right as a floor: the median post converts 2.63% of viewers. Divide by followers and 2% is badly wrong for anyone above about 5,000 followers, where the median is just 0.39% and a "good" post sits at 0.99% (5k-10k) or lower. Most people quoting "2%" never say which they mean, which is exactly why the same number can look like failure to one creator and triumph to another.
What is a good engagement rate vs followers vs vs impressions?
They are two different metrics. Versus followers divides likes plus comments by your follower count: it is public and comparable but punishes growth, so "good" falls with size (3.43% under 1k, 0.32% above 100k). Versus impressions divides by people who actually saw the post: it judges content quality and "good" stays near 4-5% at every size. Use the followers version to track your trajectory and the impressions version to judge whether your writing is working.
My engagement rate is below the typical number. How do I fix it?
Diagnose with the two denominators. If your versus-impressions rate is healthy but versus-followers is low, your content is fine and you have a reach problem: work on distribution. If your versus-impressions rate is also low, people are seeing your posts and scrolling past, so fix the content first. To see which half is dragging, split it into likes and comments, since comments are the scarcer, stronger signal.
Should I aim for the "good" or "great" engagement rate?
Aim for good (the 75th percentile), not great (the 90th). Good is repeatable: a quarter of your posts can realistically clear it. Great is a tail event you cannot summon on demand, so chasing it means feeling like a failure most of the time. Set your band's p75 as the bar you expect to meet most months, treat any great day as a bonus, and re-check the target quarterly because these are 12-month medians on a moving platform.