" height="26.80529977783203px" id="tymKb8bqC" width="128.00300311279295px"/><path d="M 0 2.417 L 0 0 L 12.909 0 L 12.909 2.417 Z" fill="rgb(126, 78, 253)" height="2.417099999999998px" id="aYr4em6zK" transform="translate(128.341 22.325)" width="12.908999999999992px"/></svg>)
"/><stop offset="1" stop-color="rgb(118, 37, 250)"/></linearGradient></defs><g d="M 19.242 21.22 L 19.362 6.204 L 19.272 6.204 L 13.757 21.22 L 10.161 21.22 L 4.796 6.204 L 4.706 6.204 L 4.825 21.22 L 0 21.22 L 0 0 L 7.283 0 L 12.109 13.607 L 12.229 13.607 L 16.844 0 L 24.247 0 L 24.247 21.22 Z M 26.421 26.113 L 26.421 23.445 L 41.407 23.445 L 41.407 26.113 Z" fill="transparent" height="26.112508199679183px" id="DvfaAIHYn" width="41.40731898311435px"><path d="M 19.242 21.22 L 19.362 6.204 L 19.272 6.204 L 13.757 21.22 L 10.161 21.22 L 4.796 6.204 L 4.706 6.204 L 4.825 21.22 L 0 21.22 L 0 0 L 7.283 0 L 12.109 13.607 L 12.229 13.607 L 16.844 0 L 24.247 0 L 24.247 21.22 Z" fill="rgb(46, 46, 46)" height="21.220180016149442px" id="pLsxRCobd" width="24.247352589074694px"/><path d="M 0 2.668 L 0 0 L 14.986 0 L 14.986 2.668 Z" fill="url(%23yD9d4I5GR-3279285344-linear-gradient)" height="2.6675085048549647px" id="yD9d4I5GR" transform="translate(26.421 23.445)" width="14.986002836263765px"/></g></svg>)

Naïlé Titah
LinkedIn polls are the easiest post you can publish. Four words, four options, one click, and the feed does the rest. So they should be a creator's best friend. The data says otherwise.
We put 11,123 polls from the last 12 months on the same scoreboard as every other format, traced four years of history to see whether the format is rising or dying, and then checked the people who get the most out of polls to find the ceiling.
The short version: polls earn the lowest median engagement of any LinkedIn format (6 median likes, versus 34 for an image post), but they reach more people than anything else (1,154 median impressions). They are seen, then ignored. That paradox is the whole story, so start with the board.
TL;DR: Polls get seen (1,154 median impressions) but not rewarded: 6 median likes vs 34 for image posts. Use one to collect votes, not to build an audience.
Where polls rank vs other LinkedIn formats
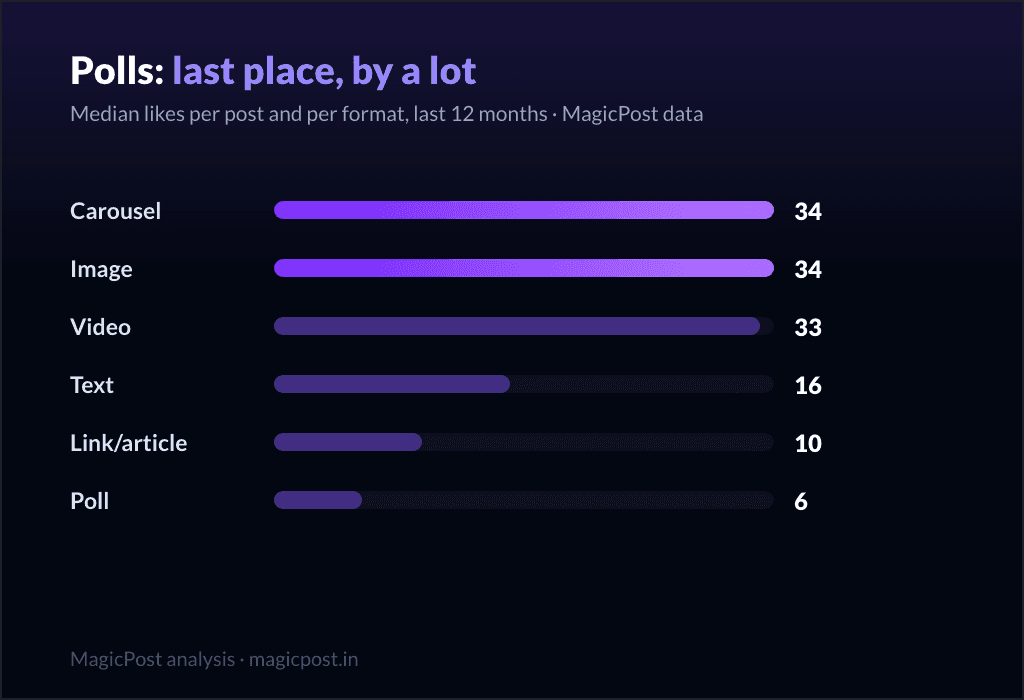
Ranked by median likes across our 12-month corpus, the poll finishes dead last:
Format | Posts measured | Median likes | Median comments |
Carousel | 69,864 | 34 | 9 |
Image | 731,288 | 34 | 7 |
Video | 122,157 | 33 | 6 |
Text only | 195,708 | 16 | 4 |
Link / article | 71,329 | 10 | 1 |
Poll | 11,123 | 6 | 3 |
A poll earns 6 median likes. The same creator posting an image earns 34. That is not a rounding gap, it is the difference between a post that travels and a post that taps out. (The full format ranking lives in our pillar study, the best LinkedIn post format in 2026.)
The one number polls do not lose on: comments. A poll earns 3 median comments, ahead of text (4) only narrowly and ahead of link posts (1) comfortably. Voting is a low-effort interaction, and polls are built to harvest it. Keep that in mind, because it is the one job polls are genuinely built for.


The twist: polls get seen
Here is where polls stop being a simple failure and start being a trap. When we look at reach instead of engagement, the ranking flips:
Post type | Posts with synced analytics | Median impressions |
Poll | 6,209 | 1,154 |
Everything else | 560,748 | 760 |
These reach figures come from the subset of posts with synced analytics: 6,209 polls and 560,748 non-poll posts. The median poll is seen by 1,154 people, versus 760 for a typical non-poll post. LinkedIn's algorithm actively pushes polls into more feeds, probably because a vote is the cheapest engagement signal it can manufacture. (More on what the feed rewards in how the LinkedIn algorithm works in 2026.)
So a poll buys you roughly 50% more reach and converts it into a fraction of the likes. You are renting a bigger stage to perform a quieter act. Every one of those 1,154 impressions is an impression you could have spent on a post that actually built something.
If you are not sure whether 1,154 is even a lot for an account your size, that depends entirely on your following: what counts as good LinkedIn reach for your size.
Polls are excellent at exactly one thing: collecting votes
If engagement is the wrong scoreboard for a poll, what is the right one? Votes. And on that scoreboard polls do their job well. Across the 1,378 polls in our corpus where we have vote data:
Median votes per poll: 52.
Top 10% of polls (p90): 965 votes.
Fifty-two responses is a real sample. If you genuinely have a question, a poll is the most efficient vote-collection tool LinkedIn offers: no DMs to chase, no spreadsheet, no survey link that halves your reach. The format is not broken. It is just optimized for data collection, not for distribution, and most people publish polls expecting the second.
Four years of polls: the tourists came, then left
The 12-month snapshot hides a wave. Here is what share of all LinkedIn posts were polls, year by year, alongside what the median poll earned:
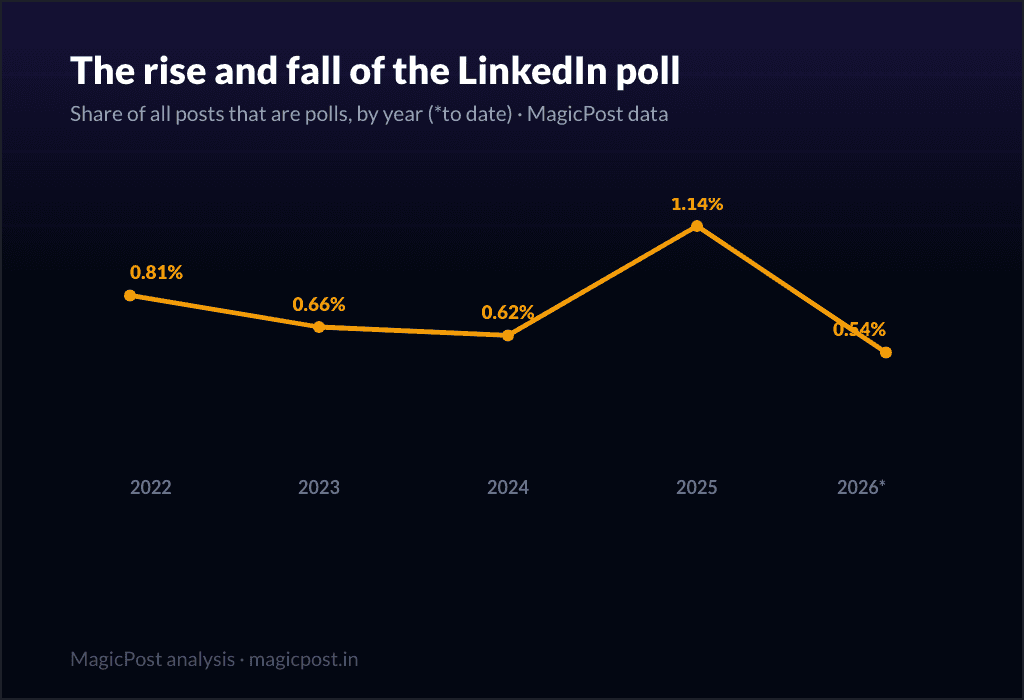
Year | Polls measured | Share of all posts | Median likes per poll |
2022 | 530 | 0.81% | 4 |
2023 | 1,130 | 0.66% | 3 |
2024 | 3,738 | 0.62% | 4 |
2025 | 15,346 | 1.14% | 5 |
2026 | 2,541 | 0.54% | 9 |
Read the share column first. Polls quietly sat below 1% of the feed for years, then spiked to 1.14% of all posts in 2025 as the engagement-hack crowd discovered them, then collapsed back to 0.54% in 2026. The bubble inflated and popped in roughly twelve months.
Now read the engagement column. As the tourists piled in, the median poll earned almost nothing: 3 to 5 likes through the boom. As they left, the survivors did slightly better: 9 median likes in 2026, the best year on record and more than double the boom-era median.
The people still publishing polls in 2026 are mostly the ones using them on purpose, and the number rewards that. (The 2026 figure covers a partial year and a thinner sample, so read it as directional, not as a turnaround.)
The pattern is the same one we see across this whole cluster: a format gets hyped as a hack, the median collapses under low-effort volume, the hack dies, and the format settles back to the small group who had a real reason to use it.
Even the masters take the haircut
The strongest proof that polls cap engagement is at the very top. We pulled the creators who perform best on polls (minimum 6 polls over the window, 5,000+ followers, people only) and compared what they earn on a poll against their overall median:
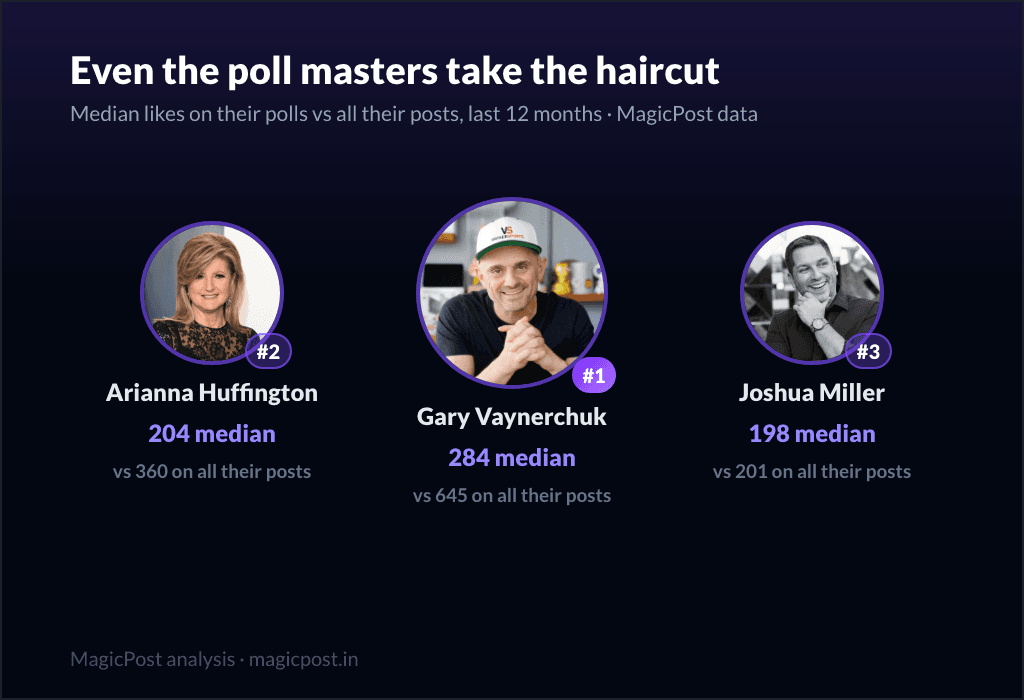
Creator | Median likes per poll | Their overall median | Polls measured |
284 | 645 | 9 | |
Arianna Huffington | 204 | 360 | 26 |
Joshua Miller | 198 | 201 | 22 |
Gary Vaynerchuk is the best poll performer we measured: 284 median likes per poll. Impressive, until you see he earns 645 on his posts overall. His polls underperform his own baseline by more than half.
Arianna Huffington shows the same haircut (204 on polls versus 360 overall). The only near-exception is Joshua Miller (198 versus 201), and he gets there by treating polls as deliberate audience research rather than as filler.
The lesson is not "you are using polls wrong." It is that the format has a ceiling that applies even to the people who use it best. If a poll costs Gary Vaynerchuk half his engagement, it will cost you at least that.
If polls are not the answer, what should you post instead? That is the real question, and it has a better answer than "guess." MagicPost's LinkedIn post ideas turns your topics and your audience into a steady stream of post angles worth publishing, so you spend your reach on content that converts it, not on a vote you did not need.
So when SHOULD you use a poll?
Polls are a tool, not a mistake. Reach for one when the vote itself is the point:
Audience research. You genuinely want to know what your audience thinks before you build something: a product decision, a topic for next week, a workshop format. The median poll gives you 52 responses to work with, fast and free.
Decision input you will actually act on. "Which of these two should I write next?" is a great poll, because the result changes what you do and your audience sees their vote matter.
A deliberate engagement touch, occasionally. A poll reaches more people than your average post, so a well-timed one can reintroduce you to lapsed followers. Use it sparingly: the reach is real, the engagement payoff is not.
And avoid one when:
You are reaching for a poll because you have nothing else to post. That is the trap the 2025 share spike was made of, and the median (3 to 5 likes back then) is the receipt.
You are using a fake question as engagement bait ("Agree? Vote yes."). LinkedIn pushes the impressions, but readers learned to scroll past, which is exactly how a format ends up seen and not rewarded. ("Polls game the algorithm" is one of several beliefs that do not survive the data: the LinkedIn myths worth dropping.)
You need the post to build authority or travel. For that, the visual formats earn roughly five times the engagement. Put the same effort into an image or a carousel and the data is not close.
The summary in one line: a poll is a survey, not a post. Judge it as a survey and it is a good one. Judge it as content and it finishes last.
Where this data comes from (poll methodology)
The figures here are MagicPost's own first-party research. Format and engagement figures come from the same corpus as our pillar study: LinkedIn posts published over the last 12 months, reshares and excluded posts filtered out, deleted posts removed, grouped by format and compared on median engagement, never averages, so a handful of viral polls cannot distort the picture. Poll engagement is measured on 11,123 polls. Reach figures come only from the posts with synced analytics (6,209 polls and 560,748 non-poll posts), aggregated and anonymized. Vote figures come from the 1,378 polls where vote counts were available. History covers 2022 to mid-2026, with medians taken within each year; because the corpus grows over time and 2026 is a partial year, year-to-year comparisons are directional by construction. Poll masters: minimum 6 polls in the window, 5,000+ followers, people only. What this does not isolate: people do not choose formats at random, and many polls are low-effort posts published when the author had nothing else to say, so part of the gap reflects the effort behind the format, not just the format itself. The masters section controls for that by comparing each creator against their own baseline. The numbers reflect the June 2026 cut and move as the corpus refreshes.
Domande Frequenti
Do LinkedIn polls work?
Mostly no, if "work" means engagement. Measured across 11,123 polls from the last 12 months, the median poll earns just 6 likes, the lowest of any LinkedIn format (an image or carousel post earns 34). Polls do get seen more than other posts (1,154 median impressions versus 760, on posts with synced analytics), but that reach converts into almost nothing. The one thing polls do well is collect votes: the median poll gathers 52 responses. So polls work as a free audience-research tool, and fail as a content format.
How much engagement does a LinkedIn poll get?
A median of 6 likes and 3 comments, across 11,123 polls over the last 12 months. For comparison, image and carousel posts earn 34 median likes, video 33, and text-only posts 16. Polls finish last on likes among every format we measured.
Do polls get more reach on LinkedIn?
Yes. On the posts with synced analytics (6,209 polls and 560,748 non-poll posts), the median poll reached 1,154 people versus 760 for a typical non-poll post, roughly 50% more. LinkedIn's algorithm actively distributes polls, but the extra impressions do not turn into extra engagement, which is why polls are best described as "seen, not rewarded."
When should I use a LinkedIn poll?
When the vote itself is the goal: audience research, a genuine decision you will act on, or an occasional reach touch to lapsed followers. The median poll collects 52 votes, making it an efficient, free survey tool. Avoid polls as everyday content or as engagement bait, because even the best poll performers take a steep cut: Gary Vaynerchuk earns 284 median likes per poll against 645 on his posts overall.
Are LinkedIn polls dying?
The hype is. Polls spiked to 1.14% of all posts in 2025 as the engagement-hack crowd adopted them, then fell back to 0.54% in 2026. Interestingly, the median poll earned more in 2026 (9 likes) than during the boom (3 to 5), because the low-effort tourists left and the people using polls on purpose stayed. The format is not dead, it is just settling back to its real, narrow use case.
> Stop renting reach you cannot convert. MagicPost brings drafting, scheduling and analytics for your LinkedIn posts under one roof, so every post earns its spot in the feed instead of buying impressions a poll throws away.

Quanto dovrebbe essere lungo un post su LinkedIn?
Scopri qual è la lunghezza ideale di un post su LinkedIn per ottenere maggiore visibilità e impressioni. Scopri consigli per ottimizzare la portata e aumentare l'engagement.

Generatore di Hashtag LinkedIn: Gli Hashtag funzionano ancora? (2026)
Gli hashtag sono ancora rilevanti su LinkedIn? Scopri come influenzano la tua strategia di contenuto, i loro pro e contro, e se dovresti includerli nei tuoi post.

Emoji di LinkedIn: come aumentare il coinvolgimento (+ elenco da copiare e incollare)
Vuoi sapere come usare le emoji di LinkedIn per aumentare l’engagement su LinkedIn? Ecco quelle che funzionano, quante usarne e un elenco completo da copiare e incollare.

Quante impressioni sono buone su LinkedIn?
Quante impressioni sono buone su LinkedIn? Ecco la risposta.

20 Migliori Esempi di Hook per LinkedIn per Maggiore Engagement
Scopri i migliori hook di LinkedIn per ottenere più interazioni sui tuoi post e uno strumento gratuito che ti aiuta a scrivere hook forti.

Come creare post a carosello su LinkedIn (2026)
Le migliori pratiche per creare e pubblicare il tuo carosello su LinkedIn. Per migliorare la tua presenza, utilizza la nostra lista di cose da fare per il tuo carosello su LinkedIn.

Video di LinkedIn: La guida completa (2026)
Padroneggia i video di LinkedIn nel 2026: scopri come creare, pubblicare e ottimizzare contenuti che aumentano portata, visibilità e coinvolgimento con strategie comprovate.

Quanti caratteri ci sono in un post di LinkedIn? (2026)
Scopri qual è il limite massimo di caratteri per i post di LinkedIn e impara come ottimizzare il tuo contenuto con strumenti di intelligenza artificiale per migliorare la tua visibilità e il tuo coinvolgimento.

The Best LinkedIn Post Format in 2026 (1.2M Posts)
The best LinkedIn post format in 2026, measured on 1.2M posts: image and carousel lead at 34 median likes, video is rising, polls are last. Full data.

How the LinkedIn Algorithm Works in 2026 (1.2M Posts)
How the LinkedIn algorithm works in 2026, measured on 1.2M posts: the levers ranked, from post length (+147%) to AI-sounding text (-57%).