"Just post in English, you'll reach more people." It is the most repeated piece of LinkedIn advice in non-English-speaking markets, and it sounds obviously true. LinkedIn is an American platform, English is the language of business, and a post in English can in theory be read by everyone.
So we tested it. We compared the posts written in English against the posts written in the local language, country by country, on the one metric that controls for audience size: engagement rate.
The useful answer: it depends on your market, and the split is clean. In the north of Europe, posting in your local language wins, often by a lot. In the south, English wins. Two countries land close to a tie.
There is no universal rule here, and anyone who gives you one is selling you something. Start with the board.
The full table: 8 countries, two languages each
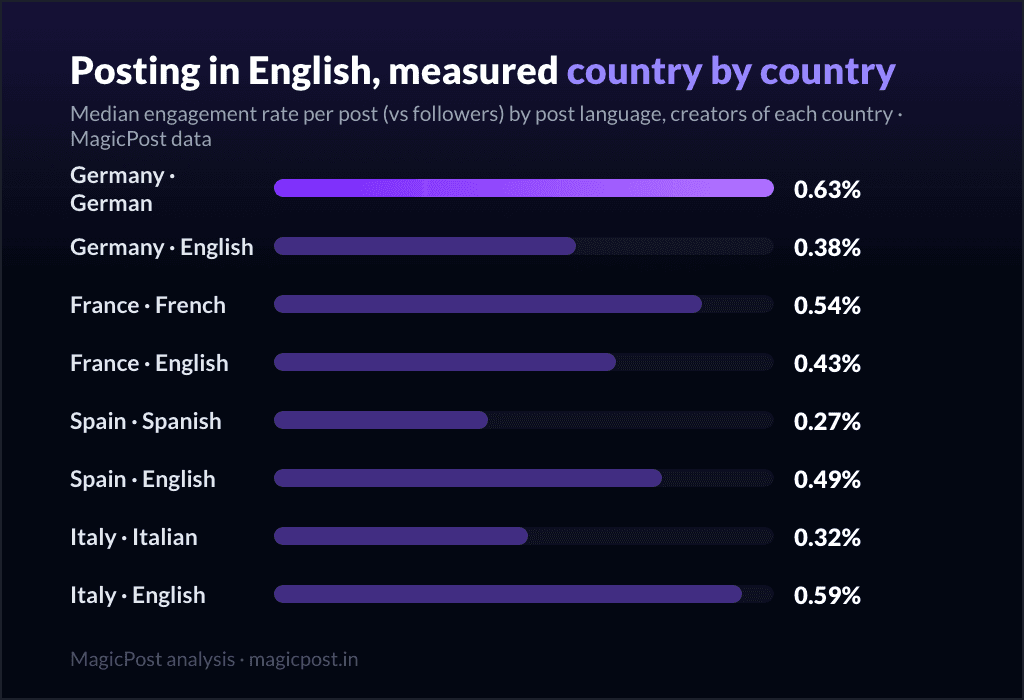
Here is every pair we measured. For each country we compared posts written in English against posts written in the local language, and ranked them on median engagement rate, which is median likes divided by the author's follower count, shown as a percentage. We use the median, never the average, so a handful of viral posts cannot distort the picture.
Country | Language | Posts measured | Median likes | Median ER (vs followers) |
Germany | German | 12,905 | 56 | 0.63% |
Germany | English | 15,562 | 54 | 0.38% |
France | French | 174,299 | 25 | 0.54% |
France | English | 9,022 | 25 | 0.43% |
Netherlands | Dutch | 5,103 | 28 | 0.53% |
Netherlands | English | 10,610 | 33 | 0.39% |
Denmark | Danish | 3,185 | 33 | 0.52% |
Denmark | English | 2,961 | 40 | 0.44% |
Italy | English | 2,151 | 27 | 0.59% |
Italy | Italian | 3,888 | 18 | 0.32% |
Spain | English | 7,090 | 38 | 0.49% |
Spain | Spanish | 5,130 | 33 | 0.27% |
Brazil | Portuguese | 9,079 | 27 | 0.26% |
Brazil | English | 864 | 8 | 0.23% |
Indonesia | English | 1,404 | 18 | 0.27% |
Indonesia | Indonesian | 2,844 | 17 | 0.22% |
Go down the pairs one country at a time and a pattern jumps out immediately. The continent splits in two.
The north: post local, the data is not close
In Germany, France, the Netherlands and Denmark, the local language wins on engagement rate, and in Germany the gap is brutal.
Germany. This is the single widest gap in the entire study. Writing in English costs you roughly a third of your engagement rate, and the giveaway is that it happens even though the raw median likes are nearly identical (56 for German, 54 for English). Same number of likes, far fewer of them per follower: the German feed simply rewards German.
France. Same median likes on both sides (25 each), yet French-language posts convert their followers into engagement more efficiently, so French wins on rate. France is also where the volume is most lopsided: 174,299 French-language posts against just 9,022 in English, a feed that runs almost entirely in French.
Netherlands. This is the interesting one, because the raw likes and the rate disagree. English posts earn more raw likes than Dutch, but Dutch creators who post in English tend to carry larger, more international followings, so those likes are spread thinner. Per follower, Dutch wins clearly.
Denmark. Same inversion as the Netherlands: English posts pull more raw likes but a lower engagement rate, because they are measured against bigger audiences. Danish takes the per-follower contest.
The north tells one consistent story: if your audience is in these markets, your local language outperforms English on a per-follower basis. And in Germany and France, it is not a marginal call.
The south: English wins
Cross into Italy and Spain and the result flips cleanly.
Italy. English nearly doubles the engagement rate of Italian, and it wins on raw likes too (27 vs 18). In Italy, the English-language post is the stronger play on both scoreboards at once.
Spain. English wins on rate and on raw likes. Spanish-language LinkedIn posts the lowest engagement rate of any pairing in the whole study, the floor of the table, which makes the case for English here unusually clear-cut.
So the same advice that costs you a third of your engagement in Germany roughly doubles it in Italy. This is why a single global rule is impossible: the right answer in Milan is the wrong answer in Munich.
The near-ties: Brazil and Indonesia
Two markets refuse to pick a side, and they are worth reporting.
Brazil. Portuguese edges English, 0.26% to 0.23%, a gap small enough to call a near-tie on rate. But look at the raw likes and the volume: Portuguese posts earn 27 median likes against just 8 for English, and we measured 9,079 Portuguese posts against only 864 in English. The thin English sample in Brazil is a signal in itself: very few creators are trying it, and the ones who do are not pulling ahead.
Indonesia. English edges Indonesian, 0.27% to 0.22%, also a near-tie, with English barely ahead on raw likes too (18 vs 17). The English-language feed in Indonesia is slightly the stronger one, but the margin is small enough that conviction matters more than language here.
Why the split? Two hypotheses (labeled as such)
We have the numbers; the why is interpretation, so treat the next two paragraphs as hypotheses, not findings.
Hypothesis 1: density of the local professional community. In markets with a dense, active local LinkedIn scene (the DACH region, France, the Benelux), the local-language feed is alive and crowded with native professionals. An English post there reads as outsider content, slightly out of place, and the algorithm and the audience both reward the native voice. That matches what we see: Germany and France, the two densest local feeds, show the widest local-language advantage.
Hypothesis 2: plugging into the international feed. In markets where the local LinkedIn community is thinner or more globally oriented, an English post stops competing in a small local pond and plugs into the enormous international feed instead. Italy and Spain may simply have smaller, less self-contained local professional communities, so English posts find a bigger and more engaged audience than the local-language equivalent. The near-ties in Brazil and Indonesia would then be markets sitting right on the dividing line.
These are plausible stories that fit the data. They are not proven, and the next section explains why you should hold them loosely.
The honest confounders
This is a comparison between posts, not a controlled experiment, and two things muddy it.
Audience intent. Creators who post in English often choose English because they are deliberately targeting an international audience. Their followers are not a random sample of their country, so we are partly measuring who they are talking to, not just what language they typed.
The Netherlands and Denmark show this most clearly. English posts there earn more raw likes but a lower engagement rate, because the English-posting creators carry larger, more international followings.
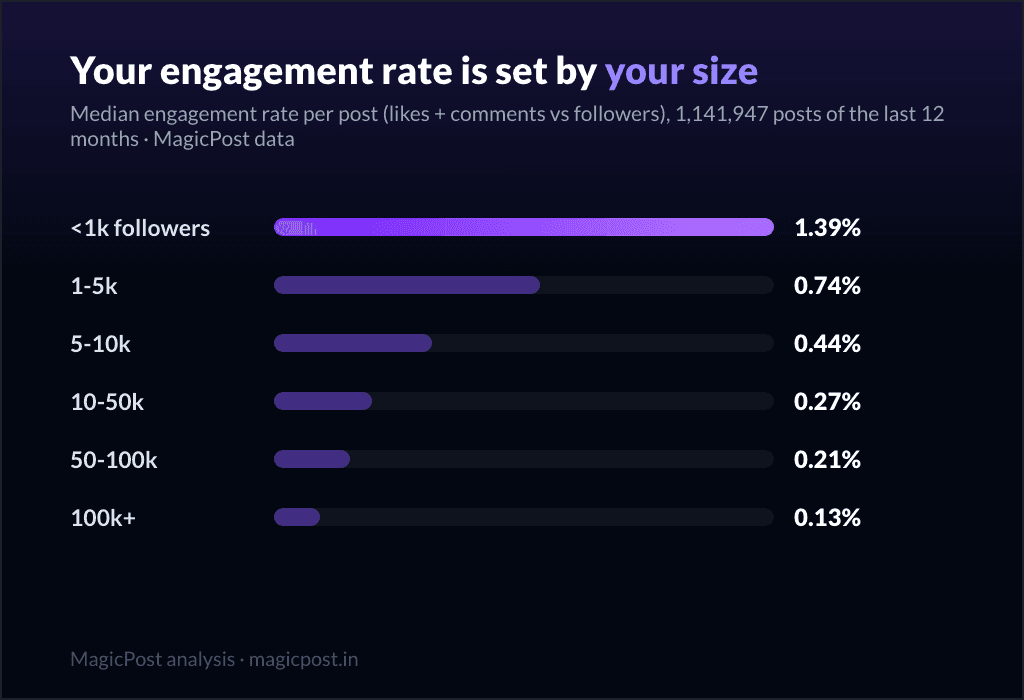
Account size. Engagement rate already corrects for follower count, which is exactly why we lead with it instead of raw likes. But it cannot correct for who those followers are, or how loyal they are. A creator with 50,000 loosely-connected international followers and one with 5,000 tight local ones will engage very differently, and language correlates with which kind of audience a creator has built.
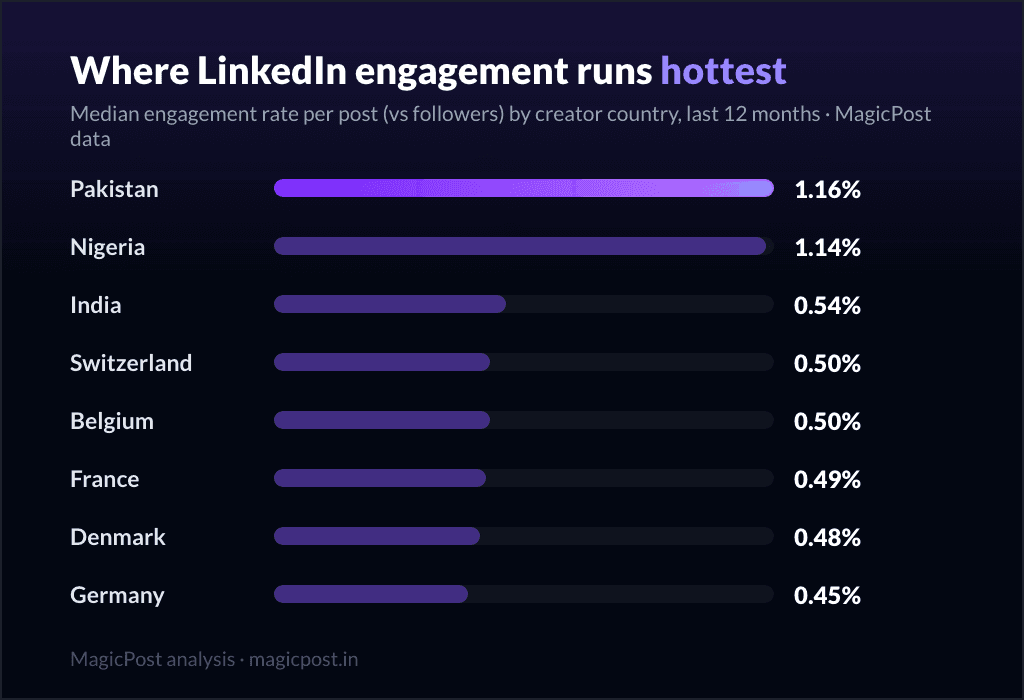
So read this as a strong directional signal, not a law of physics. (For the audience-size context behind these rates, see our companion study, LinkedIn engagement rate by country, and the explainer on what counts as a good engagement rate on LinkedIn.)
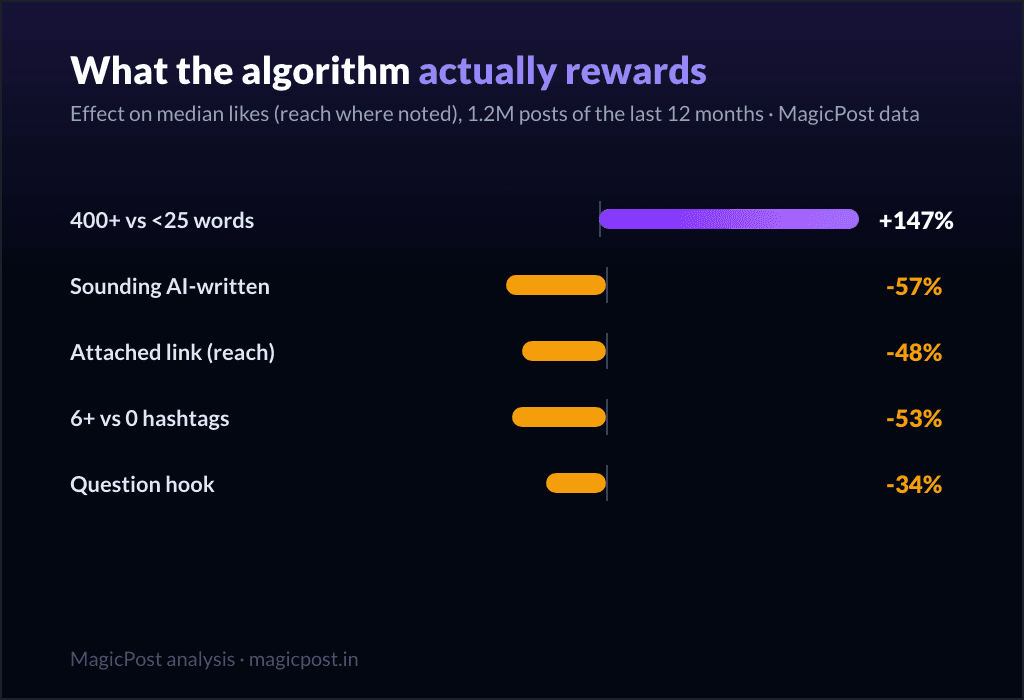
"Post in English to reach more" belongs to a wider family of moves that sound like reach and rarely deliver it. Defaulting to AI-written copy is the loudest example: measured at scale, AI posts earn less engagement on LinkedIn, the same shape as an English post in the wrong market.
And if you want to see who actually wins in these feeds, the top LinkedIn creators are studied there, language choices included.
Want to know which language actually works for YOUR audience? This data is the market average; your followers are not average. MagicPost's LinkedIn analytics lets you see how your own posts perform, language by language, so you decide from your own numbers.
So: should you post in English? A decision framework
Forget the universal rule. Ask three questions instead.
1. Where are your buyers? This is the whole decision. If your pipeline is domestic, post in your local language: German, French, Dutch and Danish all win on engagement rate in the north, and Germany makes the cost of getting it wrong the steepest in the study.
If your market is international, or your local LinkedIn community is thin, English is the stronger bet, the way Italy and Spain both show. Everything else in this framework is a refinement of that one question.
2. Which market are you actually in? The split is real and clean. North of the line (Germany, France, Netherlands, Denmark): local wins. South of the line (Italy, Spain): English wins. On the line (Brazil, Indonesia): it is close enough that conviction and consistency matter more than language choice.
3. Can you run a mixed strategy? Often the best answer is both. Lead in your local language for your domestic pipeline, and publish your international-facing pieces (a product launch, a hiring push, a conference recap) in English. You do not have to pick one language forever; you have to match each post to its intended audience.
The one thing not to do
Do not post in English in Germany or France just because LinkedIn "feels American" and English seems safer or more professional. That instinct is the exact mistake this data catches. In Germany it costs you the difference between 0.63% and 0.38%, roughly a third of your engagement rate, for no upside if your audience is German.
The platform may be American; your feed is not. Write for the people who will actually read you.
Where this data comes from
This study runs on MagicPost's own post corpus. We compared LinkedIn posts written in English against posts written in the local language, grouped by the author's country, across the 8 markets in the table above. Posts were classified by detected language and by the author's country, reshares and excluded posts filtered out. Every figure is a median, not a mean, so a few viral posts cannot move a row. Engagement rate is the author's median likes divided by their follower count, expressed as a percentage; we lead with it rather than raw likes precisely because it controls for audience size. Sample sizes per pairing are shown in the table and range from 864 posts (English in Brazil) to 174,299 (French in France).
The big caveat is language choice itself. People do not pick a posting language at random, and the ones who pick English are often chasing an international audience, which means larger and more global followings. So every gap here is part language and part who the creator is talking to. These are real posts compared side by side, not a randomized trial, which is why the verdict is a strong directional signal rather than proof. The corpus was last pulled in June 2026.
FAQ
Should you post in English on LinkedIn?
It depends on your market, and the split is clean. We compared English-language posts against local-language posts across 8 countries on median engagement rate (median likes divided by followers). In the north of Europe, the local language wins: German posts earn a 0.63% engagement rate versus 0.38% for English, French 0.54% versus 0.43%, Dutch 0.53% versus 0.39%, Danish 0.52% versus 0.44%. In the south, English wins: 0.59% versus 0.32% in Italy, 0.49% versus 0.27% in Spain. Brazil (Portuguese 0.26% vs English 0.23%) and Indonesia (English 0.27% vs Indonesian 0.22%) are near-ties. So: if your buyers are domestic and you are in the north, post local. If your market is international or you are in the south, English is the stronger play.
Does posting in English get you more reach on LinkedIn?
Not automatically, and in several markets it actively costs you. The intuition that English reaches "everyone" only pays off where the local LinkedIn community is thin enough that English plugs you into the larger international feed (Italy, Spain). In dense local markets like Germany and France, an English post reads as outsider content and earns a markedly lower engagement rate than the local-language equivalent. In Germany specifically, English posts earn a 0.38% engagement rate against 0.63% for German, roughly a third less, even though the raw median likes are nearly identical (54 vs 56).
Why does English win in Italy and Spain but lose in Germany and France?
This is interpretation, not proven fact, but the likely reason is the density of the local professional community. In Germany and France the local-language feed is large and active, so native-language posts win and English reads as out of place. In Italy and Spain the local community appears thinner or more internationally oriented, so an English post taps into the bigger global feed and outperforms the local language. Italy shows the widest English advantage (0.59% English vs 0.32% Italian), while Germany shows the widest local advantage (0.63% German vs 0.38% English).
Should I post in English if my audience is in Germany or France?
No, not if your audience is genuinely domestic. This is the one clear "don't" in the data. Posting in English in Germany or France because the platform "feels American" costs you engagement for no gain: German wins 0.63% to 0.38%, and French wins 0.54% to 0.43%. The exception is content deliberately aimed at an international audience (a product launch, a hiring push, a conference recap), where English makes sense. The best approach in these markets is often mixed: lead local for your domestic pipeline, switch to English only for the international-facing pieces.
Is this a controlled experiment?
No. This is a comparison between real LinkedIn posts, grouped by language and country, not a randomized test. The main confounder is audience intent: creators who post in English often choose English because they are targeting an international audience, so they carry larger, more global followings. That is visible in the Netherlands and Denmark, where English posts earn more raw likes but a lower engagement rate than local-language posts. We lead with engagement rate (likes divided by followers) to control for audience size, but it still cannot fully separate language from the kind of audience a creator has built. Treat the results as a strong directional signal.
When is the best time to post in these markets?
Language is only one lever; timing is another. We have dedicated, data-led guides for the two biggest markets in this study: the best time to post on LinkedIn in France and the best time to post on LinkedIn in Germany. Pair the right language with the right send time and you are optimizing both of the levers you actually control.
> Stop guessing which language works. Draft, schedule, and track every post inside MagicPost, then read the results language by language, and let your own audience settle the English-versus-local question instead of a one-size-fits-all rule.