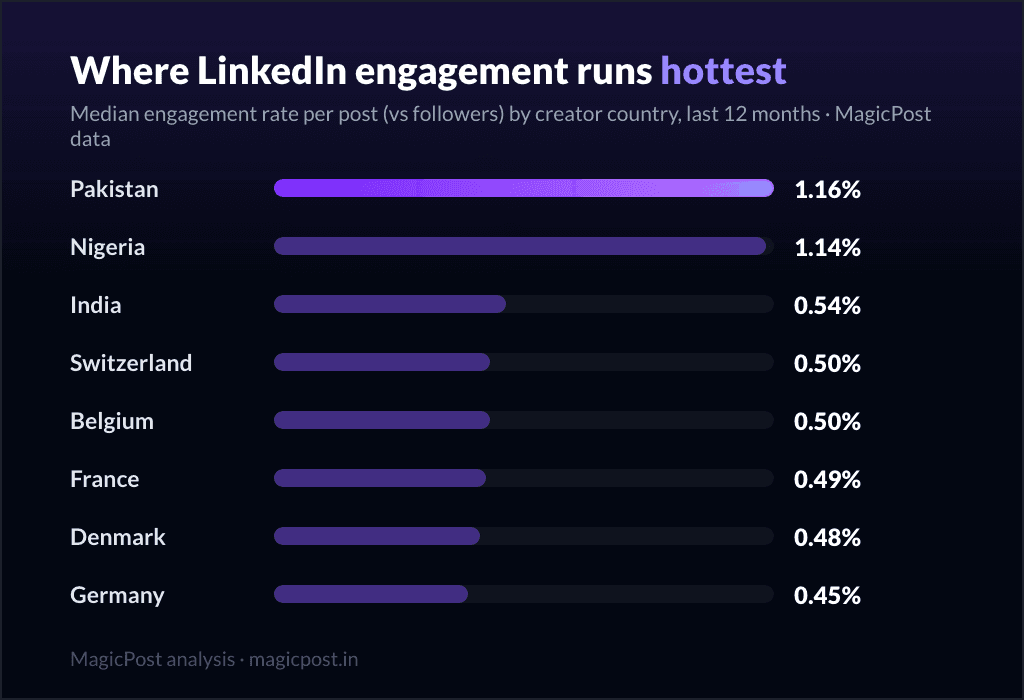
A LinkedIn engagement rate by country needs three things measured together, per post, at scale: the author's country, the post's engagement, and the follower count behind it. We hold all three, so we ranked 21 countries by the engagement rate of a typical post over the last 12 months. The leaderboard is not the one the marketing world assumes.
The short version: emerging markets run far ahead of Western ones, and the gap is wider than twofold at the top. Engagement rate here is measured the public way, (likes + comments) on a post divided by the author's follower count, expressed as a percentage. We say "engagement rate vs followers" once and mean it for the whole page. The table below carries the full order, and the mechanism behind it (why a smaller audience inflates the ratio) is where the real story sits.
The full ranking: 21 countries by median engagement rate
Find your market. Every row shows the median engagement rate of a typical post, the median likes that post earns, and how many posts we measured. Read the three columns together: the rate and the likes do not move in lockstep, and that gap is the most important thing on the page.
# | Country | Median ER vs followers | Median likes | Posts measured |
1 | Pakistan | 1.16% | 27 | 27,740 |
2 | Nigeria | 1.14% | 20 | 14,213 |
3 | India | 0.54% | 23 | 81,241 |
4 | Switzerland | 0.50% | 27 | 12,969 |
5 | Belgium | 0.50% | 26 | 10,401 |
6 | France | 0.49% | 24 | 240,848 |
7 | Denmark | 0.48% | 37 | 8,146 |
8 | Germany | 0.45% | 44 | 38,253 |
9 | United Arab Emirates | 0.45% | 31 | 13,566 |
10 | Netherlands | 0.44% | 29 | 19,120 |
11 | South Africa | 0.44% | 14 | 5,636 |
12 | Italy | 0.40% | 22 | 6,845 |
13 | Australia | 0.39% | 31 | 20,155 |
14 | Spain | 0.36% | 35 | 16,917 |
15 | Singapore | 0.35% | 42 | 8,778 |
16 | United Kingdom | 0.35% | 32 | 122,522 |
17 | Canada | 0.31% | 25 | 35,515 |
18 | Israel | 0.30% | 41 | 5,540 |
19 | United States | 0.26% | 35 | 316,709 |
20 | Brazil | 0.23% | 31 | 11,717 |
21 | Tunisia | 0.16% | 32 | 5,584 |
The spread from top to bottom is more than sevenfold (1.16% to 0.16%), which looks dramatic until you notice the likes column barely moves: from 14 to 44 median likes across the whole table. That mismatch is not noise. It is the entire mechanism, and it is worth slowing down for.
The size confounder, caught in the act
Engagement rate vs followers is a fraction, and the denominator is follower count. So the rate rises when accounts are small and falls when accounts are large, before a single word is written. Two countries can produce identical posts and post identical likes, yet the one whose creators have fewer followers will show a higher engagement rate. That is arithmetic, not audience love.
The fixture catches this red-handed. Compare the two ends of the table:
Pakistan ranks 1st on engagement rate (1.16%) but its median post earns 27 likes (squarely mid-table).
Tunisia ranks last on engagement rate (0.16%) yet its median post earns 32 likes: more than Pakistan's, more than Nigeria's 20, more than France's 24.
So a typical Tunisian post collects more likes than a typical Pakistani post, and still lands dead last on rate. The only way both can be true is that Tunisian creators in our pool carry larger follower counts, which inflates the denominator and crushes the ratio. Germany makes the same point from the top of the likes column: its median post earns 44 likes, the most of any country here, but its engagement rate is a middling 0.45% (8th). Big audiences, healthy likes, ordinary rate.
This is why every row above carries median likes and a sample size next to the rate. Engagement rate vs followers is a real, useful, comparable number, but it is a ratio, and ratios reward small accounts. Read the country leaderboard as "engagement relative to audience size," not "which country's content is best."
Why emerging markets run hotter (hypotheses, labeled as such)
We can prove the size effect from the data. The rest is interpretation, so we label it as such. Several forces plausibly push Pakistan, Nigeria and India to the top:
Smaller average accounts. The cleanest, data-backed reason. LinkedIn adoption in Pakistan and Nigeria is younger and the median creator carries fewer followers, which mechanically lifts engagement rate vs followers. This one is not a hypothesis; it is the confounder above.
Younger, denser professional communities. Newer professional networks tend to be more active per capita: people who joined recently and deliberately still read their feed, where mature-market users have long since tuned much of it out.
Tighter network norms. A mutual-support culture (you like mine, I like yours) is more visible in fast-growing markets and inflates the like count on in-network posts. Plausible, not measured here.
Saturation in mature markets. The United States (0.26%), the United Kingdom (0.35%) and Canada (0.31%) are the oldest, most crowded LinkedIn markets on Earth. More creators competing for the same scroll means each post claims a thinner slice of attention, and the largest follower bases sit in exactly these countries, dragging the ratio down twice over.
None of this means an American creator should feel bad. It means the American creator should compare against America, not against Lahore.
Where do you stand against your own market? MagicPost's LinkedIn analytics compute your engagement rate per post against your own history, so "0.30%" stops being an abstract global figure and becomes your trend line. Want the country numbers to stay current? The MagicPost Benchmark reruns them on fresh data each month and sends the update over.
Europe up close: France, Germany and the UK
Europe clusters tightly in the upper-middle of the table, which makes the small differences inside it more interesting than the gap to Pakistan. Three of the biggest European markets:
France: 0.49% (6th overall, 24 median likes, 240,848 posts). The strongest of the three on rate, and on one of the largest samples in the whole study.
Germany: 0.45% (8th, 44 median likes, 38,253 posts). Lower rate than France but the highest median likes of any country measured. The German pattern is "bigger accounts, more likes per post, diluted rate" in its purest form.
United Kingdom: 0.35% (16th, 32 median likes, 122,522 posts). Noticeably below its neighbors on rate, consistent with a mature, saturated, large-account market that looks more like the United States (0.26%) than like France.
So a French creator and a British creator posting the same content to the same-sized audience would land at quite different "average" rates, purely because of the company they keep in the data. Switzerland (0.50%) and Belgium (0.50%) edge above France; Italy (0.40%), the Netherlands (0.44%), Spain (0.36%) and Denmark (0.48%) fill out a European band that runs roughly from 0.35% to 0.50%. There is no single "European engagement rate." There is a French one, a German one and a British one, and they disagree.
What LinkedIn engagement rate by country means for you
The practical takeaway is short. Your national baseline is not the global one. If you create in Pakistan or Nigeria, a 1% engagement rate vs followers is ordinary, not exceptional, and you should expect to clear it.
If you create in the United States, the United Kingdom or Brazil, beating 0.30% already puts you ahead of the typical post in your market. Chasing the Pakistani number is chasing a denominator you do not have.
So when you judge your own engagement rate:
Compare to your market, not to the global feed. The leaderboard above is your reference row, not row 1.
Watch likes and rate together. A falling rate with steady likes usually means your audience grew, not that your content slipped. That is the Germany pattern, and it is good news disguised as bad.
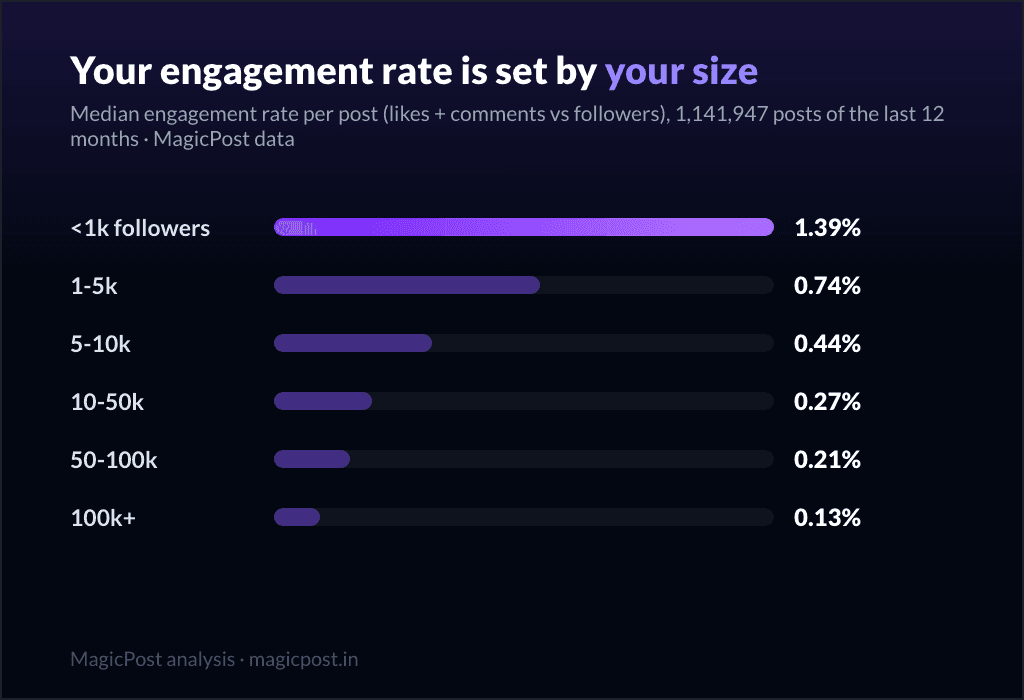
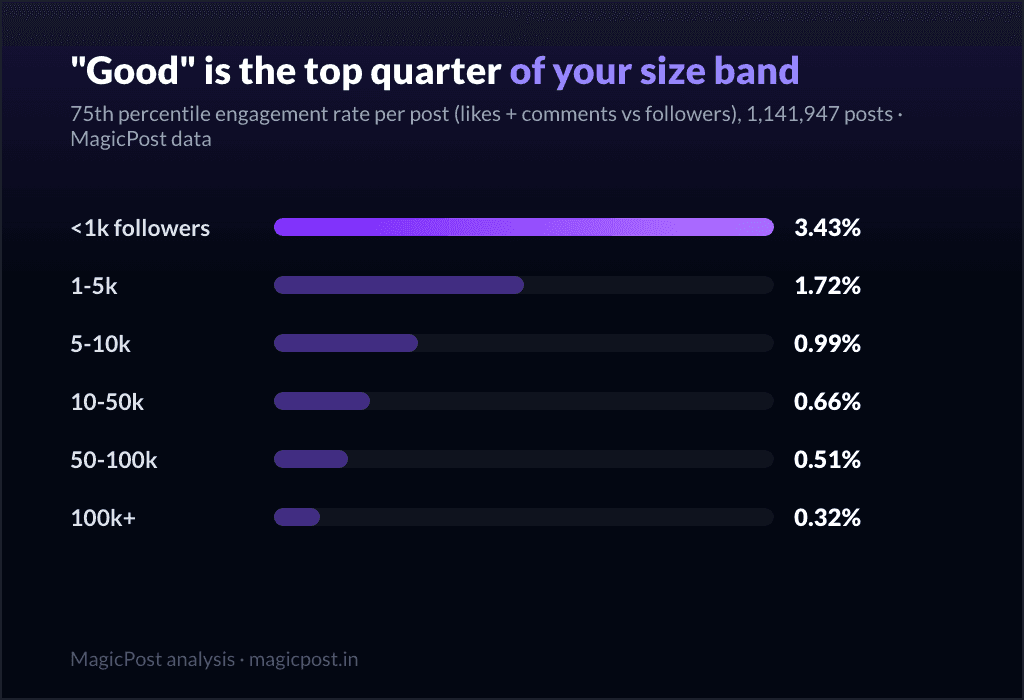
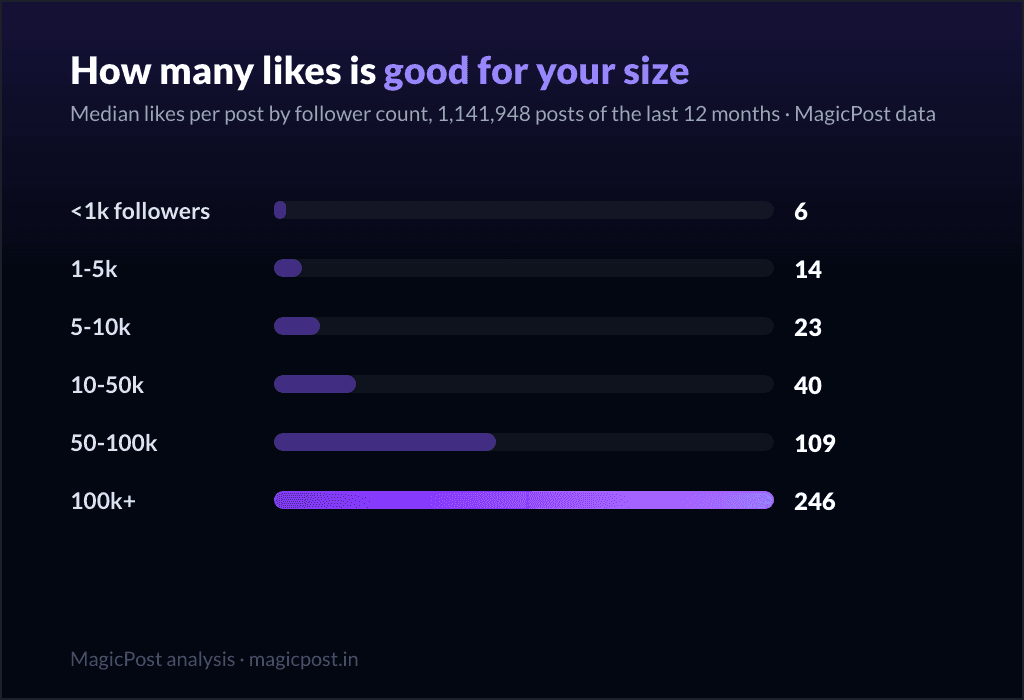
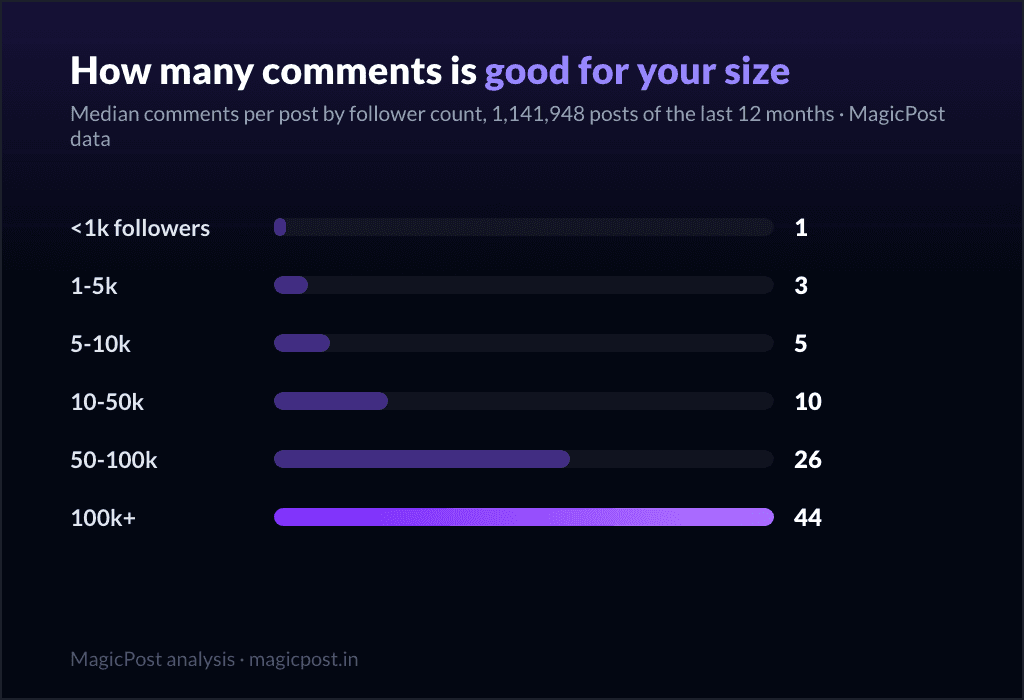
Read this alongside the size ladders. Country is one cut; account size is the deepest one. Both live in the average engagement rate on LinkedIn pillar, which shows the same metric split six ways by follower count.
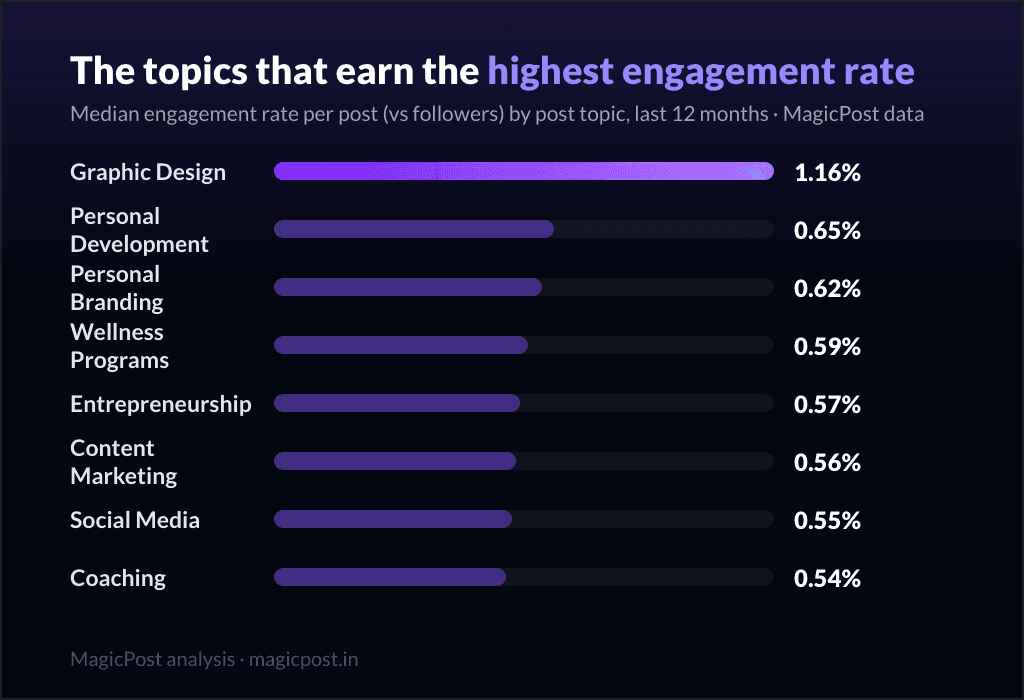
For the creator-by-creator view behind these national averages, the country tops pages name who actually leads each market: the top LinkedIn creators in Pakistan, in India, in France and in the United States. And for the other big cut of this same metric, see LinkedIn engagement rate by topic, where the same size confounder reappears in a different disguise.
Run your whole LinkedIn routine in one place. MagicPost drafts, schedules and measures your posts in a single tab, so your energy goes into what you actually have to say, not the admin around it.
One practical cousin of this question: if you are in one of these markets, should you post in English or in your language? We measured that too, and the answer splits Europe in two.
Where this data comes from
This ranking runs on MagicPost's own data, not a third-party report. The pool is LinkedIn posts from the last 12 months by individual creators (company and topic pages left out, authors under 100 followers left out), reshares and deleted posts filtered. We attribute each post to the creator's country and keep the 21 countries with enough volume for a stable median; sample sizes per country run from 5,540 posts (Israel) to 316,709 (United States) and sit on every row. Engagement rate is computed per post as (likes + comments) divided by the author's follower count, then we take the median across each country. Using the median rather than the mean keeps a country's number steady no matter how many viral posts land in its pool. Median likes are reported the same way. Because this metric is a ratio with follower count in the denominator, country rankings partly reflect how large creators' audiences are in each market, which is exactly why every row also carries median likes and n.
FAQ
Which country has the highest LinkedIn engagement rate?
Pakistan, at a 1.16% median engagement rate vs followers, narrowly ahead of Nigeria at 1.14%. Both lead the world by a wide margin: India is third at 0.54% and no other country clears 0.50%. The figure is (likes + comments) per post divided by the author's follower count, measured as a median over the last 12 months across 27,740 posts for Pakistan and 14,213 for Nigeria. Their lead is driven largely by smaller average account sizes, which lift any engagement rate measured against followers, so it reflects audience size as much as audience enthusiasm.
Why is the United States so low on LinkedIn engagement rate?
The United States sits at 0.26%, second from last among the 21 countries, despite a healthy 35 median likes per post (measured on 316,709 posts). The reason is mechanical: the US is the largest and most saturated LinkedIn market, its creators carry the biggest follower counts, and engagement rate vs followers falls as follower counts rise. American posts collect plenty of likes; they just divide those likes by very large audiences.
What is a good LinkedIn engagement rate in my country?
It depends entirely on your market. In Pakistan or Nigeria, ordinary is above 1%. In France it is around 0.49%, in Germany 0.45%, in the United Kingdom 0.35%, and in the United States 0.26%. Beating your country's median in the table above means you are ahead of the typical local post; comparing yourself to a different country's number mostly compares follower-count distributions, not content quality.
Does a higher engagement rate mean a country's content is better?
No. Engagement rate vs followers is a ratio, and the denominator is follower count, so it rewards markets with smaller average accounts regardless of content. The clearest proof in our data: a typical Tunisian post earns 32 median likes (more than Pakistan's 27 or Nigeria's 20) yet ranks last on engagement rate at 0.16%, because Tunisian creators in the pool carry larger audiences. Always read the median likes and sample size next to the rate, never the rate alone.
How many countries did you measure, and how?
Twenty-one, each with enough volume for a stable median, attributing every post to its creator's country over the last 12 months. We exclude company and topic pages and authors under 100 followers, filter out reshares and deleted posts, compute engagement rate per post, then take the median per country (never an average). Samples run from 5,540 posts (Israel) to 316,709 (United States), stated on every row in the ranking above.