Every LinkedIn dashboard shows you an impression count, and almost nobody can say what a normal one looks like. Is 500 views a flop? Is 3,000 a hit? You can't answer that from one anecdote; you need a whole population to compare against. So we built one: 539,310 LinkedIn posts with synced analytics, every count read straight off the post, then rolled up with medians so a single viral day can't tug the result.
The short answer: the median LinkedIn post gets 788 impressions. Half of all posts get fewer, half get more. But the median alone is misleading, because reach on LinkedIn is not bunched around a typical value. It is a lottery with a wildly skewed ticket distribution, and the spread is the real story.
One thing to be clear about up front: nothing here is estimated. Every count comes from a post whose author connected their analytics with us, aggregated and anonymized (n = 539,310). We don't model impressions from the outside; we read the real number.
What's a normal impression count for a LinkedIn post?
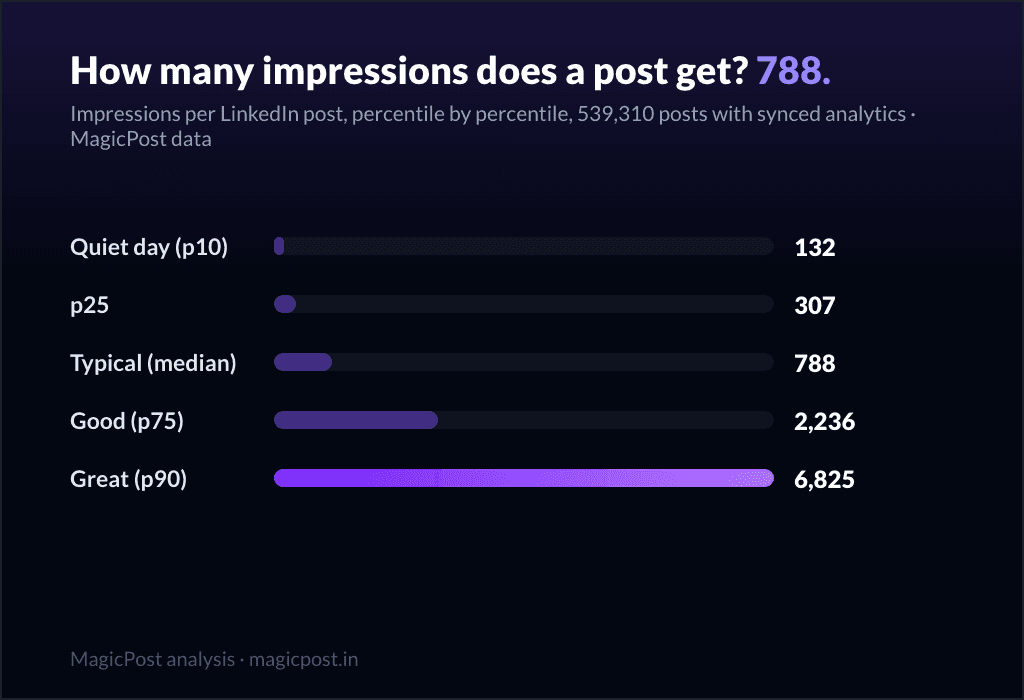
One number cannot describe reach, so here is the whole distribution. Find the row that matches your post; ignore the headline average you have read elsewhere.
Percentile | Impressions | What it means |
p10 | 132 | A quiet post, bottom tenth |
p25 | 307 | Below typical |
p50 (median) | 788 | The typical post |
p75 | 2,236 | A good day |
p90 | 6,825 | Top tenth |
p99 | 71,734 | The viral 1% |
n = 539,310 posts with synced analytics.
Read that column top to bottom and the skew jumps out. Half of all posts land between 307 and 2,236 impressions (the p25 to p75 range), while a top-decile post reaches almost nine times the median and a viral p99 day sits roughly two orders of magnitude above what a typical post sees.
The p99 row is in the table but deliberately left out of the chart above. A bar that tall would flatten every other bar into the baseline, and the chart is there to show the shape of the everyday, not the outlier.
Why we report the median, not the average
If you average these counts instead of taking the median, you get a number nobody experiences. A handful of viral posts, each pulling tens of thousands of impressions, drag the mean far above the typical post. The "average impressions" figures floating around the internet are almost always this distorted mean, which is why they always sound higher than your own dashboard.
The median is immune to that. It is the post in the exact middle: half above, half below, untouched by how extreme the top 1% gets. On a metric this skewed, the median is the summary that describes what you will actually see, and the percentile spread around it is the fair way to say whether a given post over- or under-performed. That is why every row on this page is a percentile, never an average. (The same discipline runs through our engagement-rate research.)
Your "normal" depends on your size
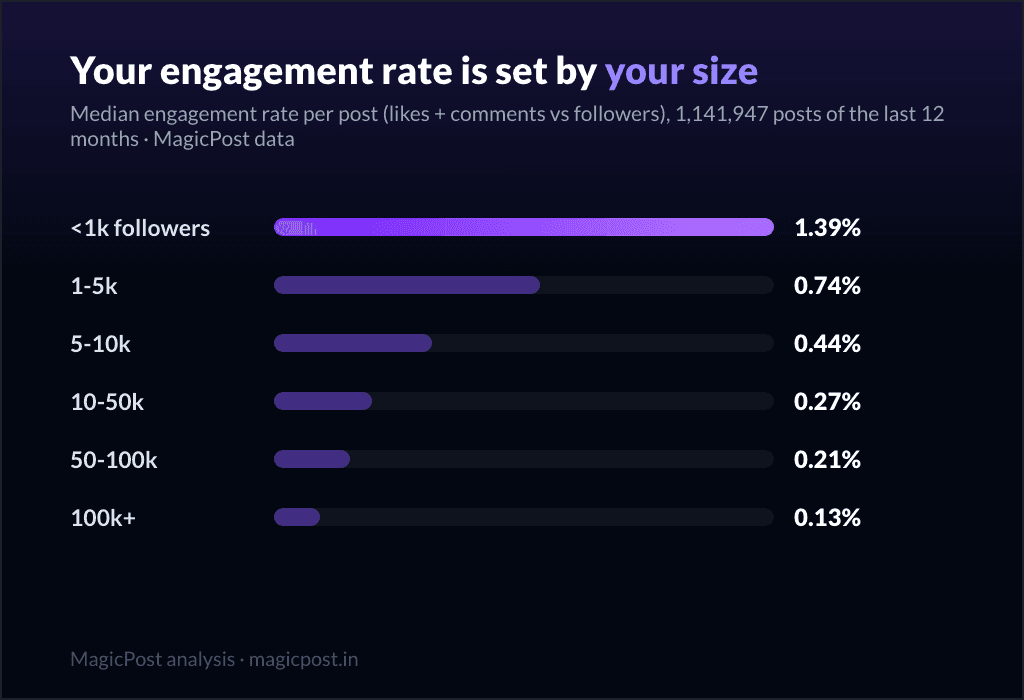
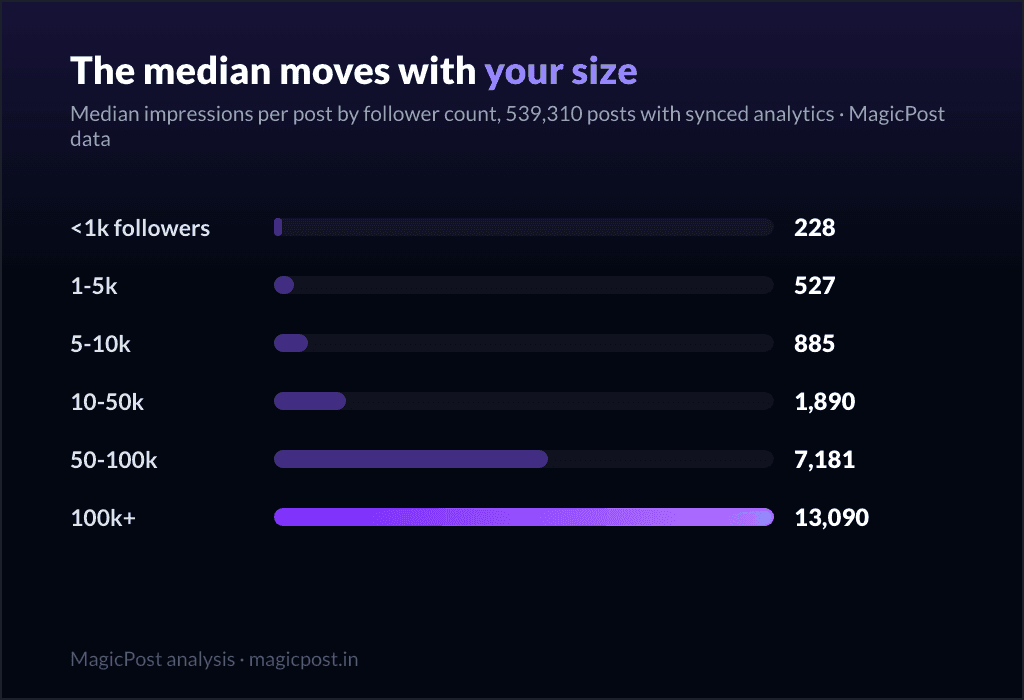
The single biggest thing that moves your impression count is how many followers you have. The global median of 788 is a blend of tiny accounts and large ones; your own typical reach sits on a ladder, and the ladder is steep.
Followers | Typical (median) | Top tenth (p90) | Posts measured |
Under 1k | 228 | 1,091 | 57,026 |
1k-5k | 527 | 2,719 | 219,744 |
5k-10k | 885 | 4,822 | 101,340 |
10k-50k | 1,890 | 12,644 | 137,863 |
50k-100k | 7,181 | 43,549 | 13,541 |
100k+ | 13,090 | 87,612 | 9,796 |
All counts from posts with synced analytics; n per row above.
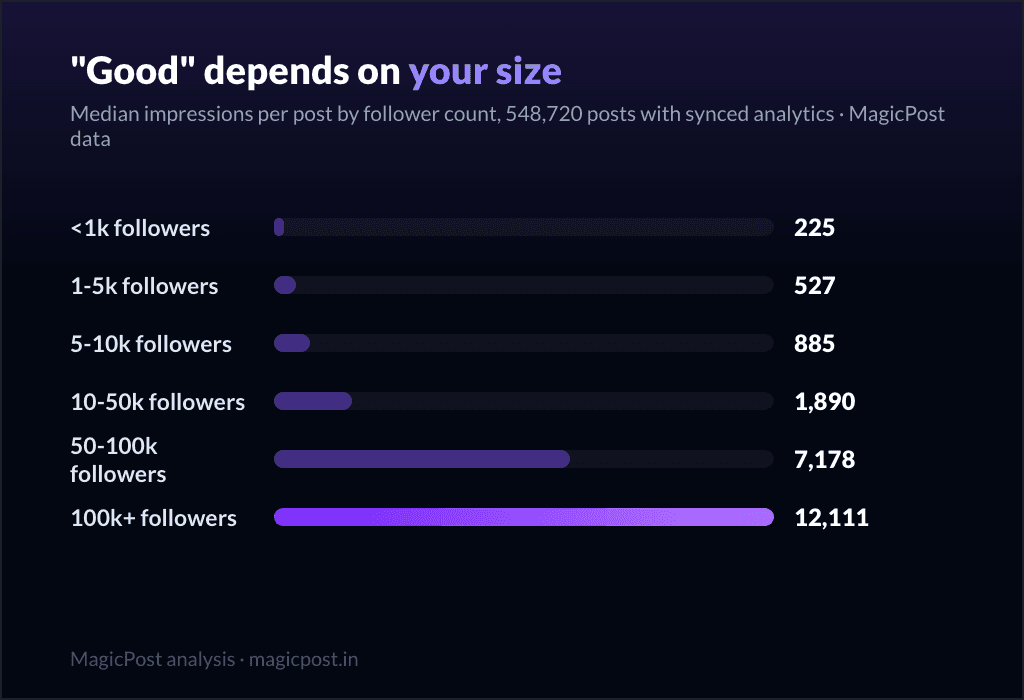
A creator under 1,000 followers whose post hits 228 impressions is having a perfectly typical day, even though that same count would be a disappointing one for a 50k account whose median is 7,181. The 100k+ band's typical post (13,090) reaches more people than the small account's best-in-ten day (1,091) by an order of magnitude. Your "average" is your band's, not the global 788, so compare up your own column and nobody else's. (If your question is really "is my number good for my size?", that is the how many impressions are good on LinkedIn cut.)
Where does your reach sit? MagicPost's LinkedIn analytics plot your own impressions per post against your history, so you can spot which posts cleared your band's median and which quietly underperformed. And rather than rebuild these reference tables yourself as the platform shifts, you can subscribe to the MagicPost Benchmark and get the refreshed figures each month.
What moves the number besides your size
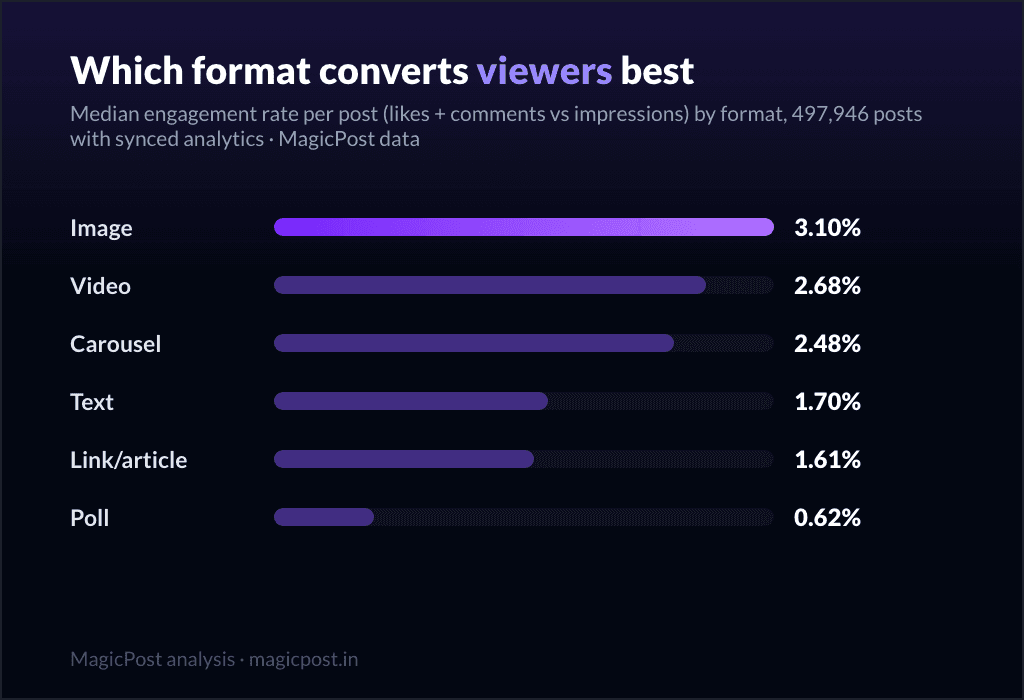
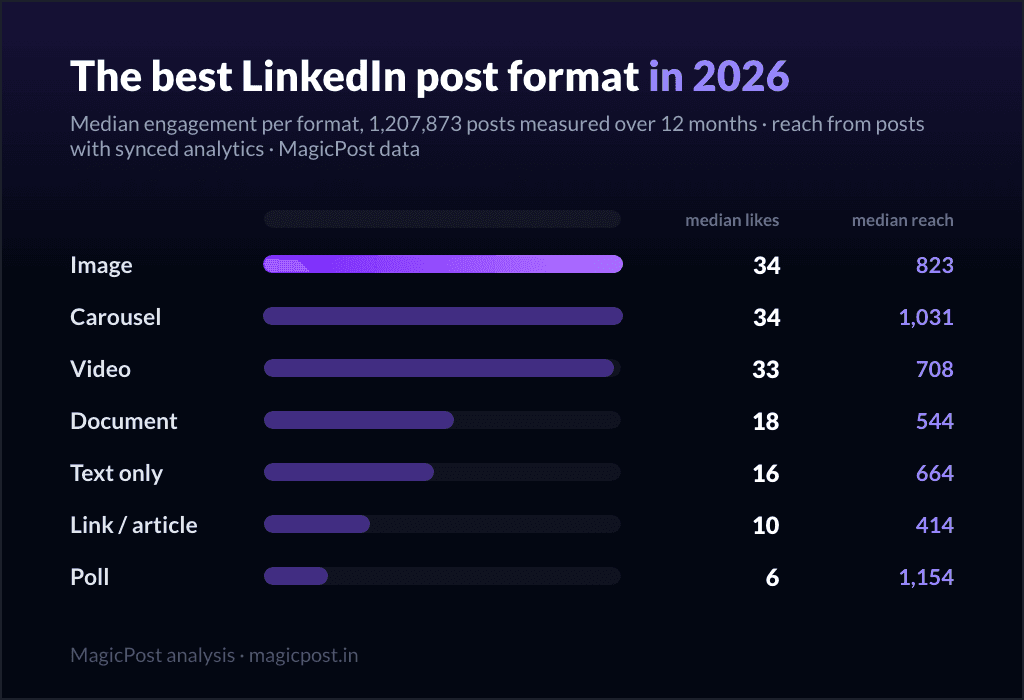
Follower count sets the baseline; the post itself shifts you up or down the ladder. Two factors move impressions most, and both have their own deep dives so we link rather than re-quote the figures here. The first is format: short-form video, images and carousels reach further than plain text or articles, which is why the engagement-rate-by-impressions picture differs sharply by format. The second is outbound links: posts that send people off LinkedIn are throttled hard, and the size of that penalty is measured in how external links cut your reach. Posting time, frequency and the first-hour engagement that triggers wider distribution matter too, but format and links are the two levers most people pull without realizing the cost.
The reach you get is then converted into engagement at a roughly constant rate, whatever your size: about two to three of every hundred people who see a post engage with it. That conversion is the content question; impressions are the distribution question. Keeping them separate is the whole point, and the engagement-rate pillar handles the conversion side.
One place for writing, scheduling and reach. MagicPost rolls the three together, so all that's left on you is the post worth putting in front of people.
Where this data comes from
All of this is first-party MagicPost data. The impression figures are drawn from 539,310 LinkedIn posts with synced analytics, published by individual creators over the last 12 months (company and topic pages excluded, authors under 100 followers excluded, reshares and deleted posts filtered out). Impressions cannot be estimated from the outside, so every count here comes from posts whose authors connected their analytics, aggregated and anonymized, with the sample size stated next to each table. Reach is skewed enough that a mean would sit far above what a typical creator sees, so every row here is a median or a percentile rather than an average. The by-size table splits the same pool into six follower bands (n per band ranges from 9,796 to 219,744).
FAQ
How many impressions does a LinkedIn post get?
The median LinkedIn post gets 788 impressions, measured on 539,310 posts with synced analytics. But reach is heavily skewed, so the median alone undersells the range: half of all posts land between 307 (p25) and 2,236 (p75) impressions, a top-tenth post reaches 6,825 (p90), the quietest tenth gets just 132 (p10), and a viral 1% post hits 71,734 (p99). There is no single "average" worth chasing, only a typical value and the spread around it.
What is a good number of impressions on LinkedIn?
It depends entirely on your follower count. Typical (median) impressions per post run 228 under 1k followers, 527 at 1k-5k, 885 at 5k-10k, 1,890 at 10k-50k, 7,181 at 50k-100k and 13,090 above 100k. A "good" day is roughly your band's top tenth (p90): 1,091 under 1k, up to 87,612 above 100k. The full "is mine good for my size" breakdown lives in how many impressions are good on LinkedIn.
Why is the average impressions figure I see online so much higher?
Because most published figures quote a mean, not a median, and impressions are extremely skewed. A small number of viral posts pulling tens of thousands of impressions each drag the average far above the typical post. The middle post in our pool of 539,310 sees 788 impressions; the mean would sit well above that and describe almost nobody. We only ever report medians and percentiles for this reason.
Why are my impressions low compared to the 788 median?
Most likely your account is below the global blend's size. The 788 median mixes all account sizes; under 1,000 followers the typical post gets just 228 impressions, which is completely normal. Beyond size, two things suppress reach: plain-text or article formats reach less than video, images and carousels, and posts with outbound links are throttled (see how external links cut your reach). Compare yourself to your own follower band, not the global figure.