" height="26.80529977783203px" id="tymKb8bqC" width="128.00300311279295px"/><path d="M 0 2.417 L 0 0 L 12.909 0 L 12.909 2.417 Z" fill="rgb(126, 78, 253)" height="2.417099999999998px" id="aYr4em6zK" transform="translate(128.341 22.325)" width="12.908999999999992px"/></svg>)
"/><stop offset="1" stop-color="rgb(118, 37, 250)"/></linearGradient></defs><g d="M 19.242 21.22 L 19.362 6.204 L 19.272 6.204 L 13.757 21.22 L 10.161 21.22 L 4.796 6.204 L 4.706 6.204 L 4.825 21.22 L 0 21.22 L 0 0 L 7.283 0 L 12.109 13.607 L 12.229 13.607 L 16.844 0 L 24.247 0 L 24.247 21.22 Z M 26.421 26.113 L 26.421 23.445 L 41.407 23.445 L 41.407 26.113 Z" fill="transparent" height="26.112508199679183px" id="DvfaAIHYn" width="41.40731898311435px"><path d="M 19.242 21.22 L 19.362 6.204 L 19.272 6.204 L 13.757 21.22 L 10.161 21.22 L 4.796 6.204 L 4.706 6.204 L 4.825 21.22 L 0 21.22 L 0 0 L 7.283 0 L 12.109 13.607 L 12.229 13.607 L 16.844 0 L 24.247 0 L 24.247 21.22 Z" fill="rgb(46, 46, 46)" height="21.220180016149442px" id="pLsxRCobd" width="24.247352589074694px"/><path d="M 0 2.668 L 0 0 L 14.986 0 L 14.986 2.668 Z" fill="url(%23yD9d4I5GR-3279285344-linear-gradient)" height="2.6675085048549647px" id="yD9d4I5GR" transform="translate(26.421 23.445)" width="14.986002836263765px"/></g></svg>)

Naïlé Titah
Ask ten marketing blogs for the average LinkedIn engagement rate and you get ten answers that quote each other, and not one that says what it divided by. We ran the number on our own corpus instead: 1,141,932 posts from the last 12 months, each rate computed on its own post, then rolled up with medians so a viral outlier can't tug the result.
There are two numbers here, not one, because "engagement rate" is really two metrics wearing the same name. Measured against followers, the median LinkedIn post earns a 0.39% engagement rate (likes plus comments, divided by the author's follower count). Measured against impressions, the median post converts 2.63% of the people who actually saw it (501,301 posts with synced analytics).
Both are real. Neither means much until you know your size, because the first one swings by a factor of ten depending on how many followers you have.
TL;DR: The median LinkedIn post earns a 0.39% engagement rate vs followers (2.63% vs impressions, measured on 1.1M posts). It varies tenfold with size: 1.39% under 1k followers, 0.13% above 100k. Compare within your band, never against the internet's 2%.
The two definitions, and why they disagree
Before any table: engagement rate = (likes + comments) on a post, divided by something. The industry never agrees on the denominator, so we publish both and never mix them.
Versus followers: the number people quote, because follower counts are public. It punishes growth: every new follower who scrolls past you silently dilutes it.
Versus impressions: the number that describes your content, because it only counts people who actually saw the post. It requires analytics access, which is why public studies rarely have it.
The gap between the two is the whole story of LinkedIn reach: your posts are typically shown to a fraction of your followers plus a slice of strangers, and how big that fraction is depends on the post, the format and the algorithm's mood.


The ladder: engagement rate vs followers, by account size
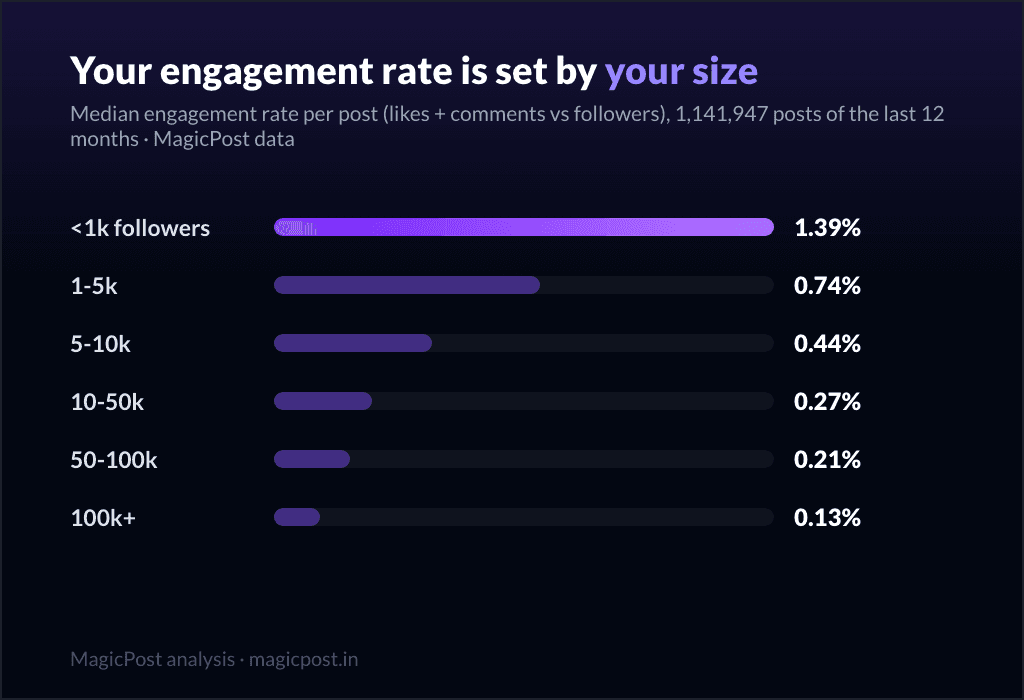
This is the table the "2% is a good engagement rate" advice never shows you. Find your row; ignore everyone else's.
Followers | Quiet (p25) | Typical (median) | Good (p75) | Great (p90) | Posts measured |
Under 1k | 0.46% | 1.39% | 3.43% | 7.25% | 81,060 |
1k-5k | 0.28% | 0.74% | 1.72% | 3.51% | 337,945 |
5k-10k | 0.17% | 0.44% | 0.99% | 2.01% | 182,219 |
10k-50k | 0.10% | 0.27% | 0.66% | 1.39% | 329,126 |
50k-100k | 0.09% | 0.21% | 0.51% | 1.03% | 75,353 |
100k+ | 0.05% | 0.13% | 0.32% | 0.67% | 136,244 |
Read it as a ladder, not a leaderboard. A creator with 800 followers posting at 1.39% and a creator with 200,000 followers posting at 0.13% are both exactly typical.
The same 2% engagement rate would be an ordinary day for the first and a career-best post for the second. There is no universal "average" to chase: there is typical, good and great for your size, and that is the comparison that tells you something. (Likes and comments have their own ladders: how many likes is good, how many comments is good.)
Why your engagement rate falls as you grow
Nothing is broken. Three mechanical reasons:
Your audience cools as it widens. Your first thousand followers chose you deliberately; your fifty-thousandth followed from one viral post and may never see you again.
Reach does not scale with followers. A 100k account does not get 100 times the impressions of a 1k account on a typical post; the reach ladder rises far slower than follower counts do.
The denominator never forgets. Every dormant follower you accumulated in 2023 still counts against every post you publish in 2026.
The proof that your content is not the problem sits in the second definition.
Measured against views, everyone converts alike
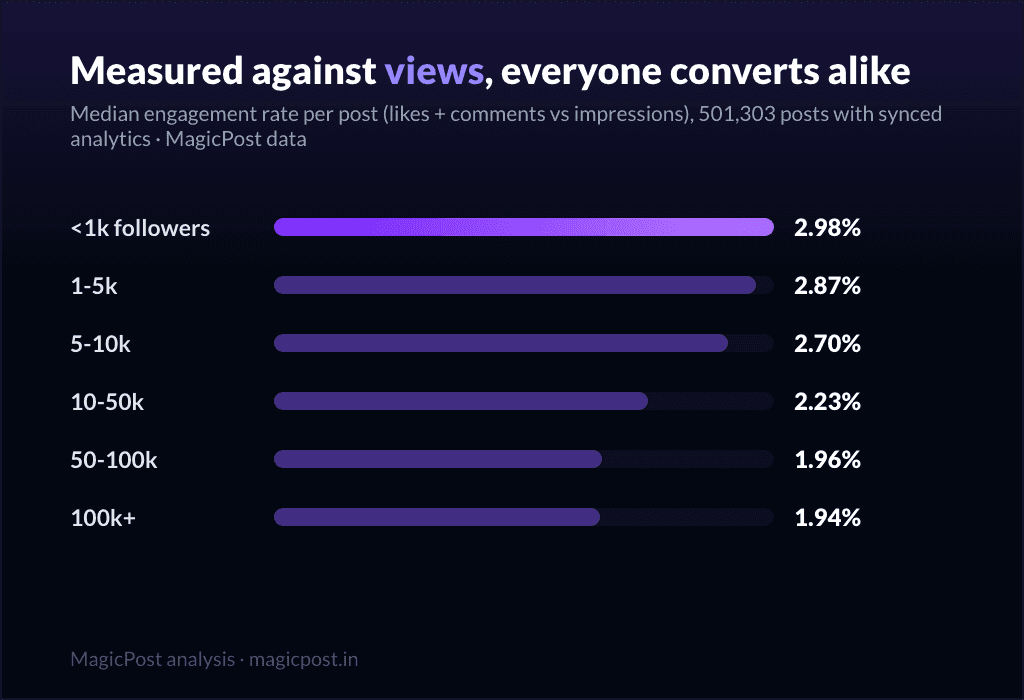
Recompute the same metric against impressions, on the 501,303 posts with synced analytics, and the ten-fold spread collapses to less than two-fold:
Followers | Typical (median) | Good (p75) | Posts measured |
Under 1k | 2.98% | 4.99% | 43,593 |
1k-5k | 2.87% | 4.85% | 200,939 |
5k-10k | 2.70% | 4.75% | 98,139 |
10k-50k | 2.23% | 4.05% | 135,295 |
50k-100k | 1.96% | 4.09% | 13,541 |
100k+ | 1.94% | 3.64% | 9,796 |
Roughly 2 to 3 people out of every 100 who see a LinkedIn post engage with it, whatever the author's size. (How many people see a post in the first place is its own question: the median post gets 788 impressions.) This is the closest thing LinkedIn has to a universal constant, and it is the fair way to judge content: if your posts convert viewers at your band's typical rate, your writing is fine and your growth question is a reach question, not a quality question.
Where do you land on these ladders? MagicPost's LinkedIn analytics compute your engagement rate per post, both ways, against your own history, so "typical for my size" stops being a guess. And if you'd rather not rebuild these reference tables by hand each quarter, the MagicPost Benchmark recomputes them on fresh data and emails you the update on a monthly subscription.
Is engagement on LinkedIn declining?
Yes and no, and the nuance is the finding. The raw trend looks like steady decline, but most of that is the corpus changing shape over the years. Split by account size, on 2.5M posts since 2022, the truth separates cleanly:
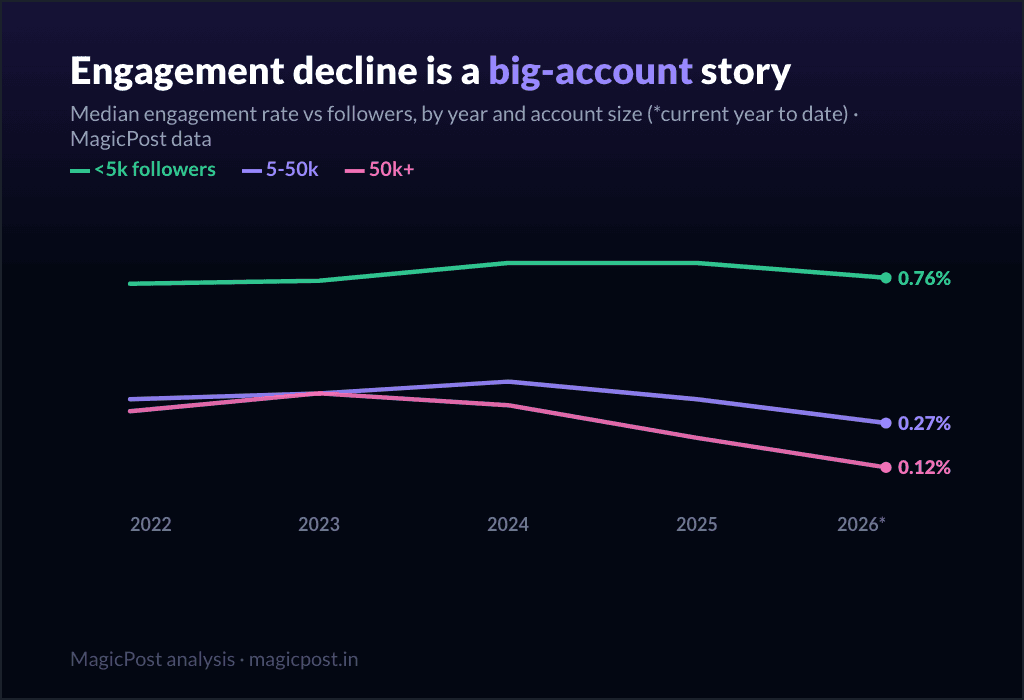
Under 5k followers: stable. 0.74% in 2022, 0.76% in 2026 to date. For small accounts, the "LinkedIn is dead" complaint does not show up in the data.
5k-50k: a mild recent dip. 0.41% at the 2024 peak, 0.27% in 2026.
50k+: a collapse. 0.37% in 2023 down to 0.12% in 2026, roughly two thirds gone in three years. More creators competing for the same attention, audiences spread thinner, and ever-larger follower counts in the denominator.
Read directionally: the mix of accounts we observe also evolves within each band (the 50k+ band counts 2,633 posts in 2022 and 109,451 in 2026). But the divergence between small and large accounts is consistent year after year, and it matches what the global top-creator data shows from the other end.
The same number, cut four ways
Engagement rate is not only a size story. Four cuts, each with its own deep dive:
By format: image posts convert viewers best (3.10% median vs impressions), video 2.68%, carousel 2.48%, text 1.70%, and polls last at 0.62%. (Ranked by median likes instead, the podium shifts: that ranking lives here.)
By content type: celebrating a win earns a 1.21% median rate while sharing a podcast or pushing a webinar earns 0.29-0.31%. Lived experience beats promotion by a factor of four.
By topic: graphic design tops the table at 1.16%; posts about AI sit near the bottom at 0.24%.
By country: Pakistan (1.16%) and Nigeria (1.14%) lead the world; France sits at 0.49%, the United States at 0.26%.
One caveat runs through all four: account size hides inside every cut (American accounts skew bigger, AI is written about by bigger accounts, and so on), which is why each table in the deep dives carries the median likes and the sample size next to the rate.
How to read your own LinkedIn engagement rate
Compute it both ways. Versus followers to track your trajectory, versus impressions to judge your content.
Compare against your band only. The ladder, not the internet's recycled "2%".
Aim for p75, not p90. "Good for your size" is a repeatable target; "great" is a tail event by definition.
If versus-impressions is healthy but versus-followers sinks, work on reach: posting time, frequency and format, not rewriting.
Recheck quarterly. These are 12-month medians on a moving platform. (Every reference number we publish, in one page: LinkedIn statistics.)
Run the writing, the scheduling and the measuring from one tab. MagicPost covers all three, so the only thing left to make is the experience worth posting about.
Where this data comes from
Everything on this page is MagicPost's own research. Core pool: 1,141,932 LinkedIn posts published over the last 12 months by individual creators (company and topic pages excluded, authors under 100 followers excluded), reshares and deleted posts filtered out. Engagement rate is computed per post as (likes + comments) divided by the author's follower count, or by the post's impressions where synced analytics exist (501,303 posts, aggregated and anonymized, n stated on every impressions claim). Every figure is a median or a percentile: with a metric this skewed, a summary built on averages would hand a few viral posts the power to move a whole row, so we don't use them. The yearly trend covers 2022 to mid-2026 and is split by account size precisely because the unsplit version is dominated by changes in corpus composition; within-band composition still drifts, so read it directionally.
Veelgestelde vragen
What is the average engagement rate on LinkedIn?
Measured on 1,141,932 posts from the last 12 months: the median post earns a 0.39% engagement rate versus the author's followers, and converts 2.63% of the people who actually saw it (versus impressions, on 501,303 posts with synced analytics). The first number varies tenfold with account size (1.39% under 1k followers, 0.13% above 100k), so always compare within your own size band.
Wat is een goed engagementpercentage op LinkedIn?
Roughly your size band's 75th percentile: 3.43% under 1k followers, 1.72% at 1k-5k, 0.99% at 5k-10k, 0.66% at 10k-50k, 0.51% at 50k-100k and 0.32% above 100k (versus followers). Against impressions, anything above 4% of viewers engaging is a good post at almost any size. Full breakdown in what is a good engagement rate on LinkedIn.
How do you calculate an engagement rate on LinkedIn?
Per post: add likes and comments, then divide either by your follower count (the public, comparable version) or by the post's impressions (the version that judges content quality). Multiply by 100 for a percentage. Decide which denominator you use and stay consistent: the two are not comparable.
Why is my LinkedIn engagement rate dropping as I grow?
Mostly mechanics, not quality. Your follower count (the denominator) grows faster than your typical reach, and a wider audience is a colder one. The data shows the same content converts viewers at 2-3% whatever your size; what falls with size is the share of your followers who see each post.
Is engagement on LinkedIn declining overall?
Only at the top. Accounts under 5k followers earn the same median engagement rate as in 2022 (about 0.75% versus followers). Accounts above 50k fell from 0.37% in 2023 to 0.12% in 2026, roughly two thirds. The averages you see quoted decline mostly because the population of accounts changes, not because every account's engagement sinks.

How Many Impressions Does a LinkedIn Post Get? 788
How many impressions does a LinkedIn post get? The median is 788 (539,310 posts measured): p25 307, p75 2,236, p90 6,825. The full spread.

Wat is een goede engagement rate op LinkedIn? (2026)
Wat is een goede engagement rate op LinkedIn? De p75 van je omvangsklasse: 3,43% onder 1k volgers, 0,66% bij 10k-50k (vs volgers); boven 4% van de kijkers overal.

How Many Likes Is Good on LinkedIn? The Median Is 28
How many likes is good on LinkedIn? The median post gets 28 (1.1M posts measured). Good for your size: 15 under 1k followers, 695 at 100k+.

Hoeveel reacties is goed op LinkedIn? De mediaan Post krijgt er 6 (1,1 miljoen Posts gemeten)
Hoeveel reacties is goed op LinkedIn? De mediane post krijgt er 6 (1,1M posts) en een kwart krijgt er hooguit 1. Goed voor je grootte: 4 onder 1k, 114 bij 100k+.

LinkedIn Engagement Rate by Topic: 44 Topics Ranked
LinkedIn engagement rate by topic, on 1.1M posts: graphic design leads at 1.16%; AI (0.24%) and HR (0.21%) sit at the bottom. 44 topics ranked.

LinkedIn Engagement Rate by Country: 21 Ranked (2026)
LinkedIn engagement rate by country: Pakistan (1.16%) and Nigeria (1.14%) lead, France 0.49%, the US 0.26%. 21 countries measured on 1.1M posts.

LinkedIn Engagement Rate by Post Format, Ranked (2026)
LinkedIn engagement rate by post format: images convert 3.10% of viewers, video 2.68%, carousels 2.48%, polls 0.62%. Measured on 497,946 posts.

Which LinkedIn Post Type Gets the Most Engagement?
Which LinkedIn post types get the most engagement? Celebrating a win leads at 1.21%; podcast shares and webinar pushes trail at 0.29-0.31%. 22 types ranked.

Hoeveel impressies zijn goed op LinkedIn?
Hoeveel impressies zijn goed op LinkedIn? Hier is het antwoord.

The Best LinkedIn Post Format in 2026 (1.2M Posts)
The best LinkedIn post format in 2026, measured on 1.2M posts: image and carousel lead at 34 median likes, video is rising, polls are last. Full data.