" height="26.80529977783203px" id="tymKb8bqC" width="128.00300311279295px"/><path d="M 0 2.417 L 0 0 L 12.909 0 L 12.909 2.417 Z" fill="rgb(126, 78, 253)" height="2.417099999999998px" id="aYr4em6zK" transform="translate(128.341 22.325)" width="12.908999999999992px"/></svg>)
"/><stop offset="1" stop-color="rgb(118, 37, 250)"/></linearGradient></defs><g d="M 19.242 21.22 L 19.362 6.204 L 19.272 6.204 L 13.757 21.22 L 10.161 21.22 L 4.796 6.204 L 4.706 6.204 L 4.825 21.22 L 0 21.22 L 0 0 L 7.283 0 L 12.109 13.607 L 12.229 13.607 L 16.844 0 L 24.247 0 L 24.247 21.22 Z M 26.421 26.113 L 26.421 23.445 L 41.407 23.445 L 41.407 26.113 Z" fill="transparent" height="26.112508199679183px" id="DvfaAIHYn" width="41.40731898311435px"><path d="M 19.242 21.22 L 19.362 6.204 L 19.272 6.204 L 13.757 21.22 L 10.161 21.22 L 4.796 6.204 L 4.706 6.204 L 4.825 21.22 L 0 21.22 L 0 0 L 7.283 0 L 12.109 13.607 L 12.229 13.607 L 16.844 0 L 24.247 0 L 24.247 21.22 Z" fill="rgb(46, 46, 46)" height="21.220180016149442px" id="pLsxRCobd" width="24.247352589074694px"/><path d="M 0 2.668 L 0 0 L 14.986 0 L 14.986 2.668 Z" fill="url(%23yD9d4I5GR-3279285344-linear-gradient)" height="2.6675085048549647px" id="yD9d4I5GR" transform="translate(26.421 23.445)" width="14.986002836263765px"/></g></svg>)

Naïlé Titah
Most "LinkedIn statistics" pages recycle each other. One blog cites a 2021 number, the next cites the blog, and three years later the same stale figure is everywhere with no sample size attached. We did the opposite. Every number below is measured first-party on our own corpus of 1,207,797 LinkedIn posts from the last 12 months, with the sample size stated next to each stat. No recycled stats. We measured everything ourselves.
This is the reference page: 32 numbers, six sections, each one linking to the full study behind it. If a stat here matters to you, the deep-dive has the breakdowns, the history and the confounders we accounted for.
How to cite us. When you quote a number from this page, cite it as "MagicPost analysis of 1.2M LinkedIn posts, June 2026" with a link back to this page. The numbers refresh quarterly, so the link stays current even when the figures move.
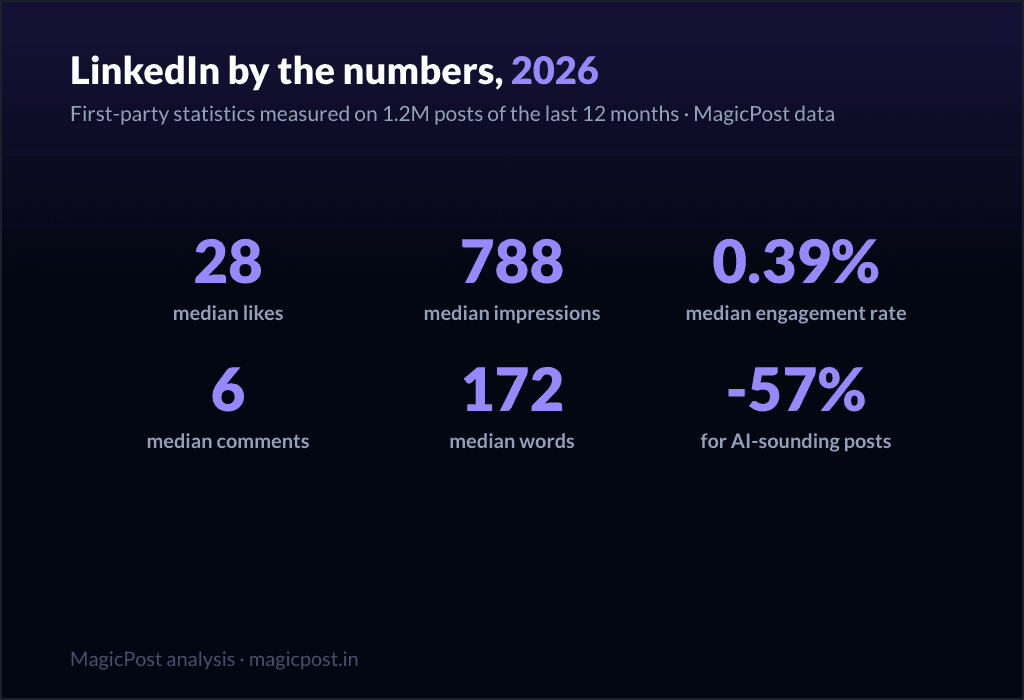
TL;DR: 32 first-party LinkedIn statistics measured on 1.2M posts: the median post earns 28 likes, 6 comments and 788 impressions; engagement rate is 0.39% vs followers; question hooks cost 34%; AI-sounding posts earn 57% less. Every number carries its sample size and refreshes quarterly.
The typical LinkedIn post
Start with the center of gravity. These are the medians, never averages, so a handful of viral posts cannot inflate them. This is what a normal LinkedIn post actually earns.
The median LinkedIn post gets 28 likes (on 1,141,948 posts). Half of all posts get fewer. If you cleared 28, you beat the median post on the platform. How many likes is good on LinkedIn?
The median post gets 6 comments (on 1,141,948 posts). Comments are scarcer than likes by roughly five to one. How many comments is good on LinkedIn?
The median post gets 788 impressions (on 539,310 posts with synced analytics). Most posts are seen by a few hundred people, not thousands. How many impressions does a LinkedIn post get?
The median engagement rate against followers is 0.39% (on 1,141,932 posts). For every 1,000 followers, the median post earns engagement from about four of them. Average engagement rate on LinkedIn
The median engagement rate against impressions is 2.63% (on 501,301 posts). Of the people who actually see a post, a little over one in forty engage. Average engagement rate on LinkedIn
The median post is 1,011 characters (about 170 words) long (on 1,201,112 posts). The "short and punchy" advice does not match what the median creator actually publishes. How many characters in a LinkedIn post?
A top-1% post reaches 71,734 impressions (on 539,310 posts with synced analytics). The gap between the median and the ceiling is enormous: virality is rare and extreme. How many impressions does a LinkedIn post get?


Engagement and reach by account size
Almost every "engagement rate" number you have read ignores account size. That is the single most important variable, and it cuts both ways.
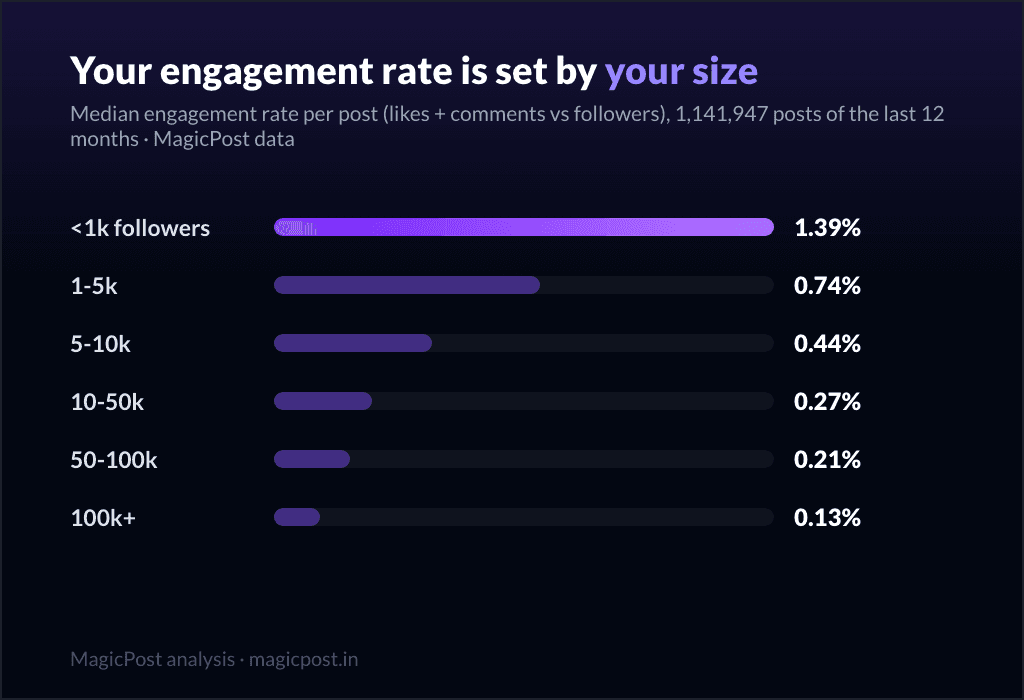
Engagement rate against followers falls roughly 10x as accounts grow: 1.39% median under 1k followers, 0.13% above 100k (on 1,141,947 posts). Small accounts look more "engaged" per follower because reaching all your followers is easy when you have few. Average engagement rate on LinkedIn
Viewers convert at nearly the same rate at every size: 2.98% down to 1.94% of viewers engage, small account or huge (on 501,303 posts). Measured against the people who actually saw the post, a giant account is barely less engaging than a tiny one. The follower-based gap is a reach effect, not a quality effect. Average engagement rate on LinkedIn
Median impressions scale with size: 228 under 1k followers, 1,890 at 10-50k, 13,090 above 100k (on 539,310 posts with synced analytics). Reach is where account size pays off, not engagement rate. How many impressions are good on LinkedIn?
The engagement decline is a top-account story: under-5k accounts have held steady since 2022, while 50k+ accounts fell from 0.37% to 0.12% (on 2,554,217 posts). "LinkedIn engagement is dying" is true only if you are big. Small accounts are flat. Average engagement rate on LinkedIn
The hottest countries by engagement rate are Pakistan at 1.16% and Nigeria at 1.14%; the US sits at 0.26% (on 1,022,415 posts). Engagement rate is partly a function of audience geography, which makes cross-region comparisons misleading. LinkedIn engagement rate by country
The best-performing post type is celebrating a win at a 1.21% median rate; podcast shares trail at 0.29% (on 643,164 posts). What you post about moves engagement as much as how you post it. LinkedIn post types and engagement
Formats
Format is the highest-leverage choice you make before writing a word. We measured every format LinkedIn offers.
Best formats by median likes: image 34 and carousel 34, video 33, text 16, link post 10, poll 6 (on 1,207,797 posts). Visual formats earn roughly double plain text; link posts and polls trail badly. The best LinkedIn post format
Video is the only format still climbing: 7.0% of posts in 2022 to 11.2% in 2026 (on 2,638,974 posts). Every other format's share is flat or falling; video is where the feed is heading. The best LinkedIn post format
Plain text collapsed as a share of the feed: 27.7% of posts in 2022 to 16.3% in 2026 (on 2,638,974 posts). Creators abandoned the format that pays the least. The best LinkedIn post format
The median carousel has 8 slides, but 13-20 slides earn 58 median likes versus 22 for 2-5 (on 67,765 carousels). Carousels reward depth: the longest decks earn more than 2.5x the shortest. How many slides in a LinkedIn carousel?
The median video is 51 seconds, but 2-5 minute videos earn the most at 48 median likes (on 100,758 videos). The "keep it under 30 seconds" folklore is wrong: the sweet spot is one to five minutes. LinkedIn video guide
Polls get 6 median likes, last of all formats, but 1,154 median impressions, first of all formats (on 11,123 polls). The algorithm pushes polls; readers stopped rewarding them. Seen, not rewarded. Do LinkedIn polls work?
Writing and structure
Inside a single format, the words still decide a lot. Length, hooks, hashtags, emojis and links each leave a measurable mark.
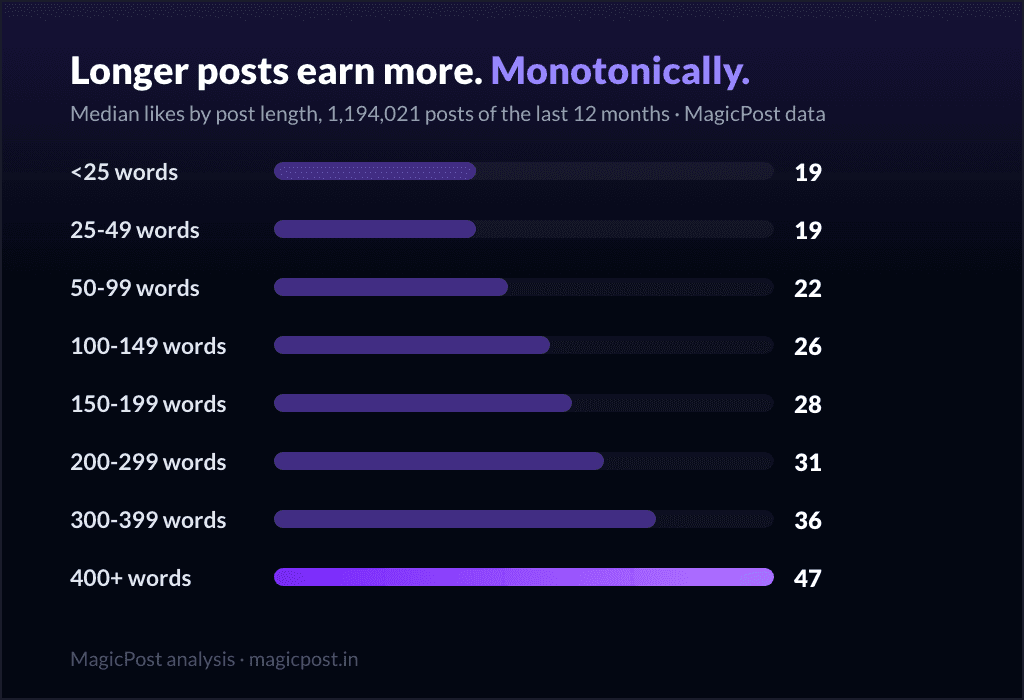
Post length pays, monotonically: 19 median likes under 25 words, 47 at 400+ words (on 1,194,021 posts). Longer, structured posts beat short takes in every range we measured. How long should a LinkedIn post be?
The median post more than doubled in length: 74 words in 2022, 172 in 2026 (on 2,613,435 posts). The whole feed moved toward longer writing as creators learned length pays. How long should a LinkedIn post be?
Question hooks underperform: 19 median likes versus 29 for statement openers, a 34% gap (on 1,179,958 posts). Almost every guide teaches the opposite. The data disagrees. LinkedIn hooks
Number-led hooks overperform: 35 median likes versus 26, a 35% lift (on 1,179,960 posts). Opening with a concrete number outperforms opening with a question by a wide margin. LinkedIn hooks
One hashtag is the peak: 35 median likes versus 32 with none, dropping to 15 at five or more (on 1,207,829 posts). A single tag helps slightly; piling them on hurts. Are hashtags still useful on LinkedIn?
Hashtag usage collapsed: 67.9% of posts in 2022 to 23.2% in 2026 (on 2,653,125 posts). The feed quietly learned that hashtag spam does not work. Are hashtags still useful on LinkedIn?
Emojis help, mildly: 30 median likes with versus 26 without; the peak is 1-2 emojis (on 1,201,129 posts). A touch of emoji helps; a wall of them does not. LinkedIn emojis
An attached link card halves reach: 414 median impressions versus 795 without (on 566,957 posts with synced analytics). The single most expensive habit on LinkedIn. LinkedIn external links and reach
A URL in the post body costs nothing: 858 median impressions versus 786 with no link (on 566,957 posts with synced analytics). It is the link preview card that the algorithm punishes, not the act of linking. Paste the URL as text. LinkedIn external links and reach
Where do your own numbers stand against these? MagicPost's LinkedIn analytics break down your posts the same way we built this page: likes, comments, reach and engagement rate, scored against your size. And if you want these reference numbers refreshed in your inbox every month, subscribe to the MagicPost Benchmark for the monthly report.
AI and writing style
LinkedIn filled with AI-written posts. We measured what that costs, using an in-house detector that scores how human or machine a post reads.
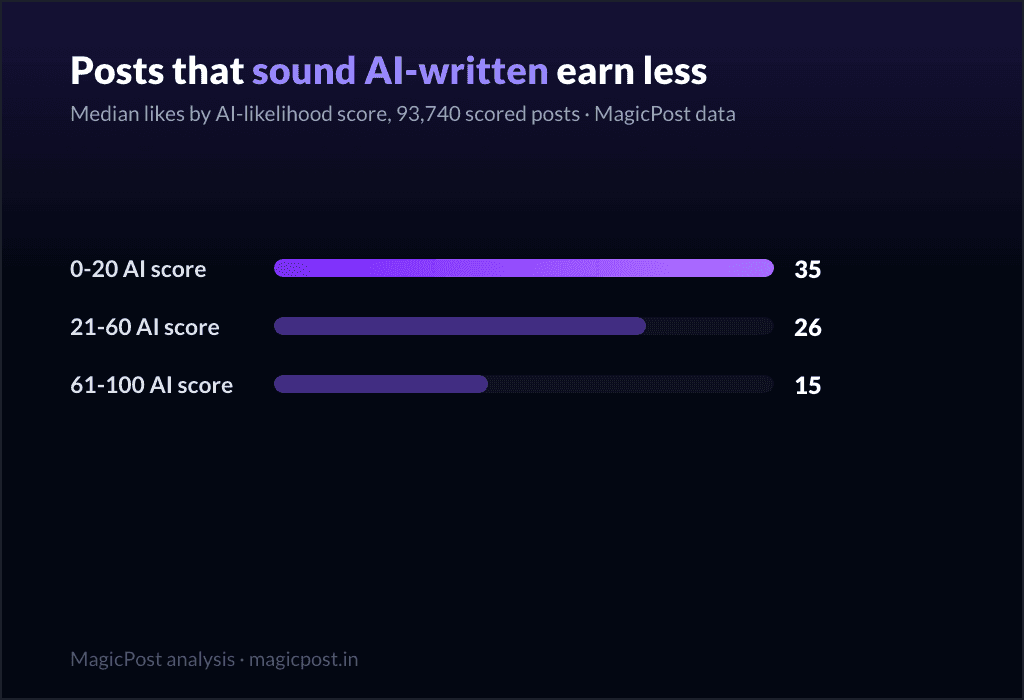
AI-sounding posts earn less: 15 median likes at an AI score of 61-100 versus 35 at 0-20, a 57% drop (on 93,740 scored posts). The more a post reads like a machine wrote it, the worse it performs. Do AI posts get less engagement on LinkedIn?
Winning posts overwhelmingly read human: 97% of top posts score as human on our detector (on 45,965 posts). The platform does not need an explicit "AI penalty" when readers already vote against AI-sounding writing. Does LinkedIn penalize AI content?
The em dash traced AI adoption: 0.7% of posts in 2019 rose to a 15.6% peak, now receding. The punctuation mark became a tell for machine-written posts, then creators learned to avoid it. The em dash as an AI sign on LinkedIn
Timing
When you post sets a ceiling on how far a post can travel before the algorithm moves on.
The best day to post is Tuesday, scoring 100, with Monday underrated at 95; weekend posting collapses (on 831,350 posts). The midweek window is real and measurable, and the weekend penalty is steep. Best day to post on LinkedIn
Timing is the easiest variable to fix, because it costs nothing to change. The companion studies cover the full picture: the best time to post on LinkedIn hour by hour, and how all these effects fit together in the LinkedIn algorithm in 2026.
How to cite these statistics
Cite any number on this page as "MagicPost analysis of 1.2M LinkedIn posts, June 2026" with a link to this page. The figures refresh quarterly, so the citation does not go stale between updates. Each stat above links the full study it comes from.
Where this data comes from
Everything on this page is MagicPost's own research, measured first-party. The core corpus is 1,207,797 LinkedIn posts published over the last 12 months (reshares and deleted posts excluded), from real persons, not company pages. We report medians, never averages, so a handful of viral posts cannot distort any figure. Engagement is likes (and comments where noted); engagement rate is computed against followers and, separately, against impressions.
Reach and impression figures come from the subset of posts with synced analytics (around 539,000 posts), aggregated and anonymized. History figures span 2019 to 2026 on the same growing corpus, so year-over-year comparisons use medians within each year and should be read as directional. Every number is dated June 2026 and refreshes quarterly. The sample size sits next to each stat above so you can weigh each one yourself.
Put the numbers to work. With MagicPost you can write, schedule and analyze all your LinkedIn content in one place, with the AI post generator already writing with these patterns in mind: right format, right length, human-sounding, no engagement-killing habits.
Veelgestelde vragen
How many likes does the average LinkedIn post get?
The median LinkedIn post gets 28 likes, measured on 1,141,948 posts. We report the median rather than the average because a few viral posts pull averages far above what a normal post earns. Half of all posts get fewer than 28 likes, so if you clear that, you have beaten the typical post on the platform.
What is a good engagement rate on LinkedIn in 2026?
The median engagement rate is 0.39% against followers (on 1,141,932 posts) and 2.63% against impressions (on 501,301 posts). But account size matters: it falls from 1.39% under 1k followers to 0.13% above 100k. A "good" rate depends on your size, so compare yourself against accounts your own size.
How many impressions does a LinkedIn post get?
The median post gets 788 impressions, measured on 539,310 posts with synced analytics. Reach scales steeply with account size: 228 median impressions under 1k followers, 1,890 at 10-50k, and 13,090 above 100k. A top-1% post reaches 71,734 impressions, which shows how rare and extreme virality is.
What is the best post format on LinkedIn?
By median likes across 1,207,797 posts: image and carousel posts tie at 34, video is close behind at 33 and is the only format still growing its share of the feed, text-only earns 16, link posts 10, and polls just 6. Visual formats earn roughly double plain text.
Do AI-written posts perform worse on LinkedIn?
Yes. Posts scoring 61-100 on our AI detector earn 15 median likes, versus 35 for posts scoring 0-20, a 57% drop (on 93,740 scored posts). And 97% of top posts read as human on the same detector (on 45,965 posts). Readers vote against machine-sounding writing without LinkedIn needing an explicit penalty.
Hoe lang moet een LinkedIn-post zijn?
Longer posts perform better, monotonically: 19 median likes under 25 words rising to 47 at 400 or more words (on 1,194,021 posts). The median post is now 1,011 characters, about 170 words, and has more than doubled since 2022 (74 words to 172).
When is the best day to post on LinkedIn?
Tuesday is the best day (scoring 100), with Monday underrated at 95, while weekend posting collapses (measured on 831,350 posts). Midweek is the reliable window, and the weekend penalty is steep enough to matter.

Average Engagement Rate on LinkedIn: 0.39% (2026 Data)
What is the average engagement rate on LinkedIn? 0.39% vs followers, 2.63% vs impressions, on 1.1M posts. Full ladders by follower count.

The Best LinkedIn Post Format in 2026 (1.2M Posts)
The best LinkedIn post format in 2026, measured on 1.2M posts: image and carousel lead at 34 median likes, video is rising, polls are last. Full data.

How the LinkedIn Algorithm Works in 2026 (1.2M Posts)
How the LinkedIn algorithm works in 2026, measured on 1.2M posts: the levers ranked, from post length (+147%) to AI-sounding text (-57%).

How Many Impressions Does a LinkedIn Post Get? 788
How many impressions does a LinkedIn post get? The median is 788 (539,310 posts measured): p25 307, p75 2,236, p90 6,825. The full spread.

How Many Likes Is Good on LinkedIn? The Median Is 28
How many likes is good on LinkedIn? The median post gets 28 (1.1M posts measured). Good for your size: 15 under 1k followers, 695 at 100k+.

Hoe lang moet een LinkedIn-bericht zijn?
Leer wat de ideale lengte is van een LinkedIn-bericht om meer zichtbaarheid en impressies te krijgen. Ontdek tips om het bereik te optimaliseren en de betrokkenheid te stimuleren.

Wat is een goede engagement rate op LinkedIn? (2026)
Wat is een goede engagement rate op LinkedIn? De p75 van je omvangsklasse: 3,43% onder 1k volgers, 0,66% bij 10k-50k (vs volgers); boven 4% van de kijkers overal.

Wat is de beste tijd om te posten op LinkedIn 2026
De beste tijd om op LinkedIn te posten in 2026: werkdagen en -uren. Piekmomenten, regels voor tijdzones en nuances in de industrie die berichten omzetten in echte zichtbaarheid.

11 Patronen om een door AI geschreven LinkedIn Post te herkennen in 2026
We analyseerden 46.000 LinkedIn-posts om de 11 patronen te vinden die een post in 2026 als AI laten klinken, met echte voorbeelden van topcreators en hoe je elk patroon oplost.
Schaadt AI-schrijven je LinkedIn-bereik? (Gegevens van 2026)
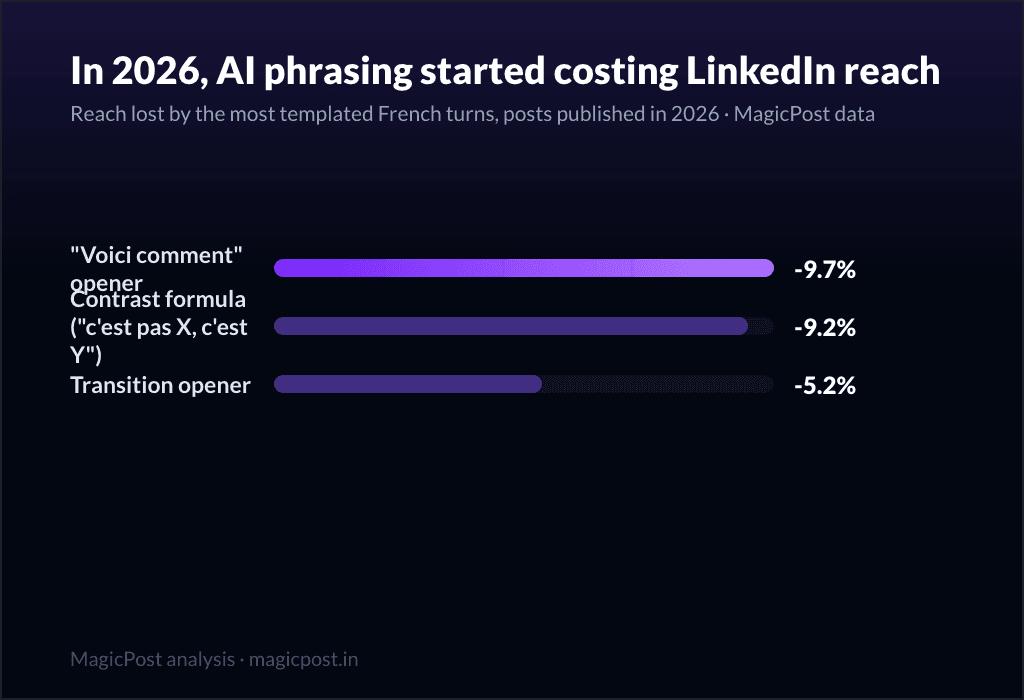
Schaadt AI-schrijven je LinkedIn-bereik? We hebben 287.000 posts gemeten. Tot 2026 maakte het nauwelijks uit; in 2026 kost elk van vier sjabloonmatige wendingen een Engelse post ongeveer 4% tot 7%.