" height="26.80529977783203px" id="tymKb8bqC" width="128.00300311279295px"/><path d="M 0 2.417 L 0 0 L 12.909 0 L 12.909 2.417 Z" fill="rgb(126, 78, 253)" height="2.417099999999998px" id="aYr4em6zK" transform="translate(128.341 22.325)" width="12.908999999999992px"/></svg>)
"/><stop offset="1" stop-color="rgb(118, 37, 250)"/></linearGradient></defs><g d="M 19.242 21.22 L 19.362 6.204 L 19.272 6.204 L 13.757 21.22 L 10.161 21.22 L 4.796 6.204 L 4.706 6.204 L 4.825 21.22 L 0 21.22 L 0 0 L 7.283 0 L 12.109 13.607 L 12.229 13.607 L 16.844 0 L 24.247 0 L 24.247 21.22 Z M 26.421 26.113 L 26.421 23.445 L 41.407 23.445 L 41.407 26.113 Z" fill="transparent" height="26.112508199679183px" id="DvfaAIHYn" width="41.40731898311435px"><path d="M 19.242 21.22 L 19.362 6.204 L 19.272 6.204 L 13.757 21.22 L 10.161 21.22 L 4.796 6.204 L 4.706 6.204 L 4.825 21.22 L 0 21.22 L 0 0 L 7.283 0 L 12.109 13.607 L 12.229 13.607 L 16.844 0 L 24.247 0 L 24.247 21.22 Z" fill="rgb(46, 46, 46)" height="21.220180016149442px" id="pLsxRCobd" width="24.247352589074694px"/><path d="M 0 2.668 L 0 0 L 14.986 0 L 14.986 2.668 Z" fill="url(%23yD9d4I5GR-3279285344-linear-gradient)" height="2.6675085048549647px" id="yD9d4I5GR" transform="translate(26.421 23.445)" width="14.986002836263765px"/></g></svg>)

Naïlé Titah
You published the post. Now you want to know if it worked, without tabbing over to a dashboard, picking a date range, and squinting at a chart. If you already work in Claude or Cursor, the answer can come back in the same chat.
In one line: ask how your LinkedIn posts did, and the MagicPost MCP returns your totals and your best posts right in the conversation. You can also benchmark a post against what actually performs in your niche. This guide is about your own numbers; analytics across a team or clients is its own guide.
TL;DR: Ask Claude how your LinkedIn posts did and MagicPost returns your totals (impressions, likes, comments, reposts) and top posts for any window, refreshing the data on demand. It also benchmarks you against high-performing posts in your niche, so you know whether a number is actually good, all without opening a dashboard. Team analytics is a separate guide.
How do you check your LinkedIn analytics in Claude?
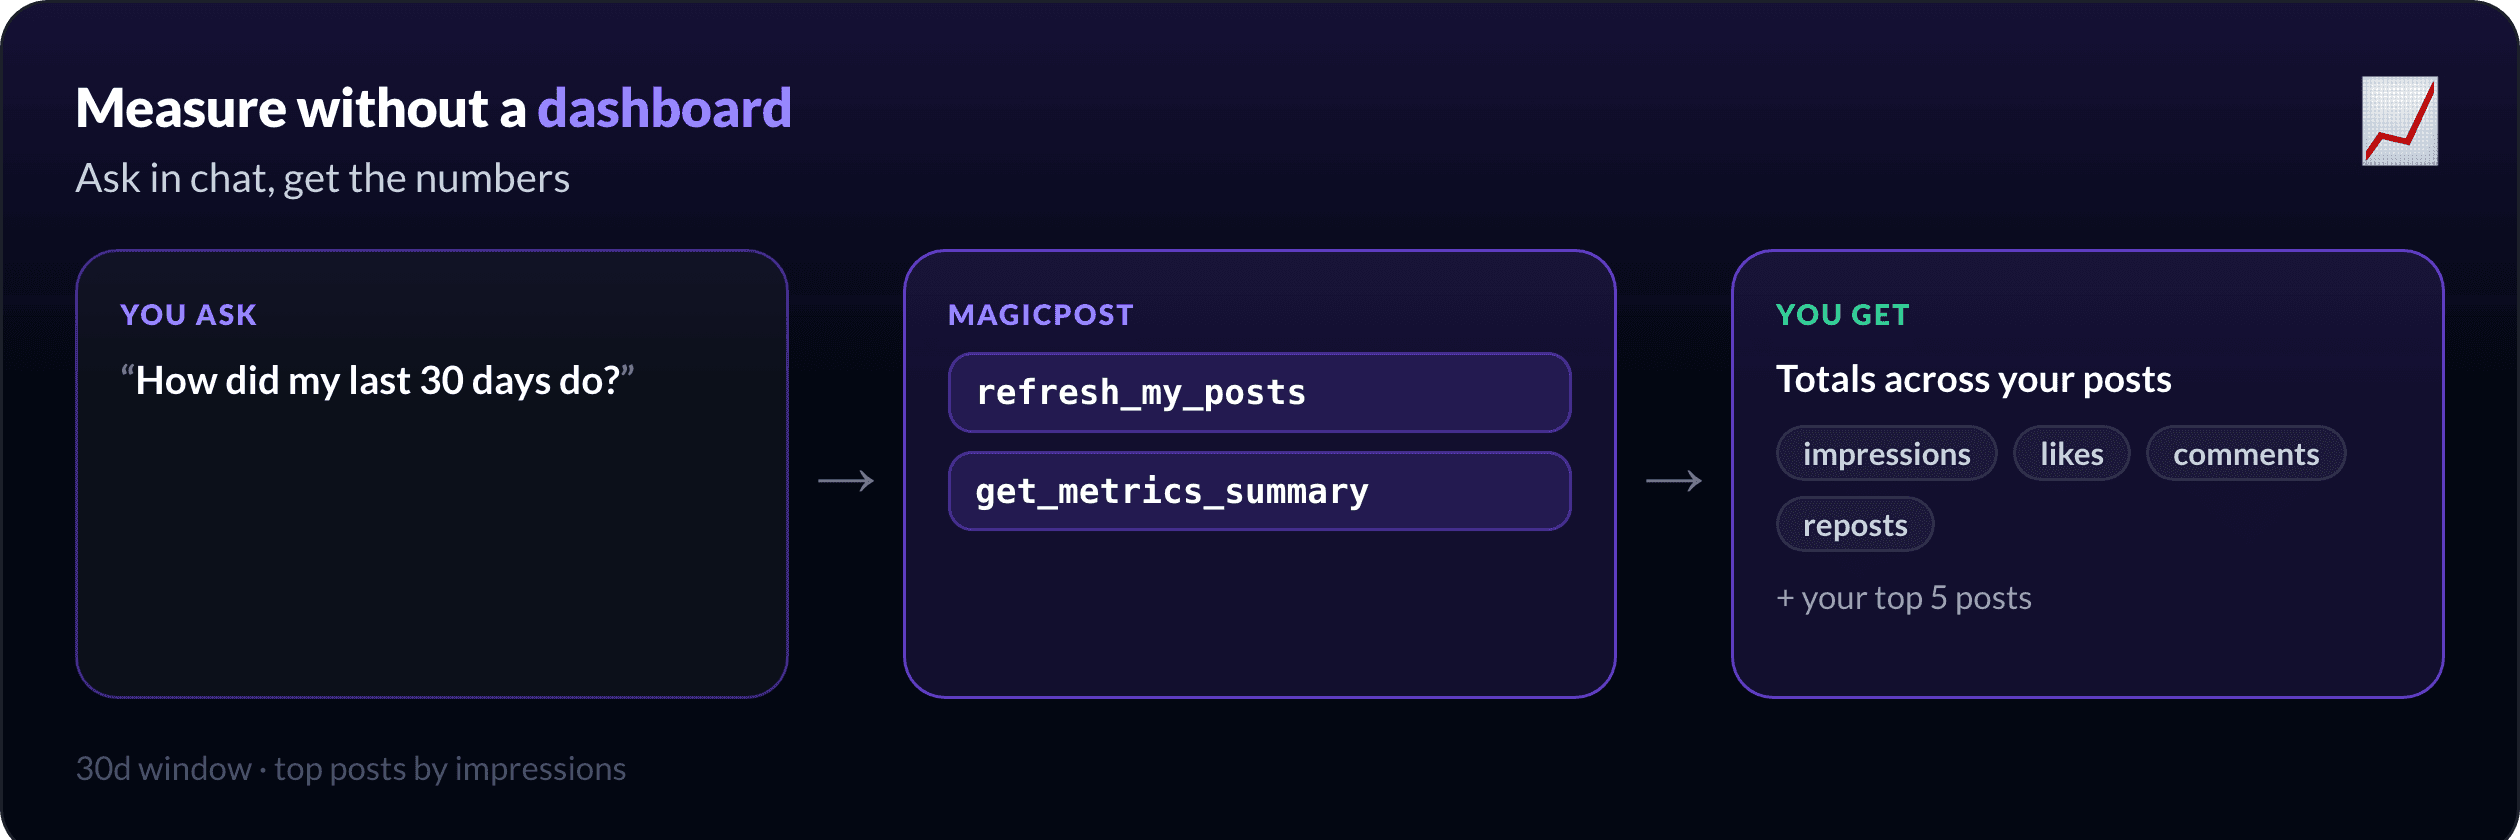
Connect the MagicPost MCP and ask in plain language.
"How did my last 30 days perform? Give me the totals and my top 5 posts by impressions."
`get_metrics_summary` returns the top-line numbers and your best posts for the window you name, like `30d`. If the data feels behind, refresh it first.
"Refresh my LinkedIn data, then summarise this month."
`refresh_my_posts` forces a fresh pull so the summary is current. No dashboard, no export, just the numbers where you are already working.


What numbers do you get back?
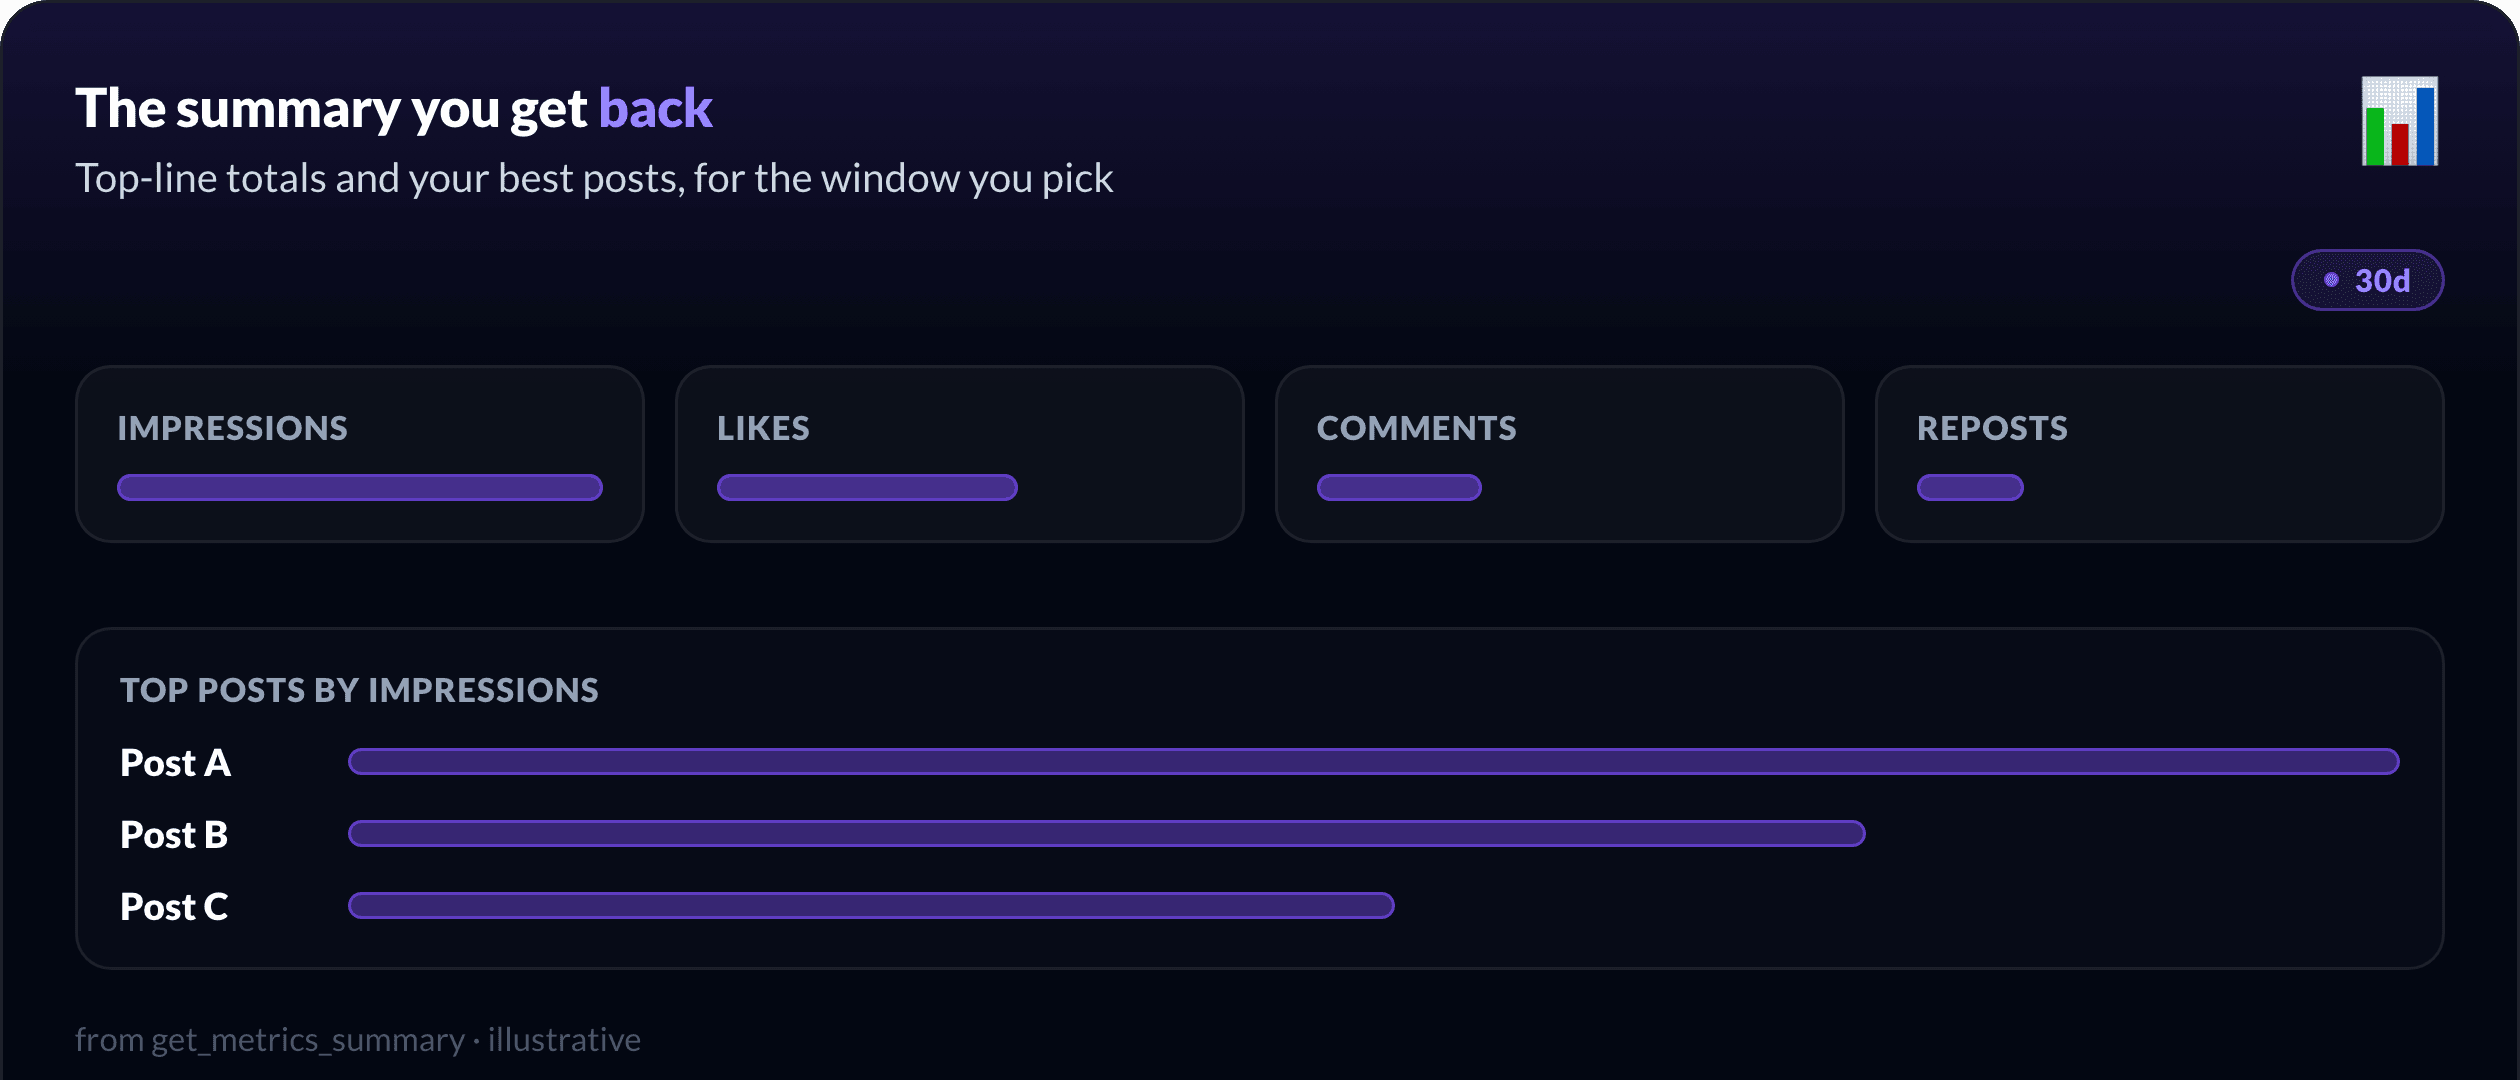
The summary is built to answer "what worked", not to drown you in a hundred metrics.
You get the top-line totals, impressions, likes, comments and reposts, plus your top posts by impressions for the window. Ask for `30d`, `90d`, or a longer stretch, and the same shape comes back, so you can compare this month against last without rebuilding a report.
How do you know if a post is actually good?
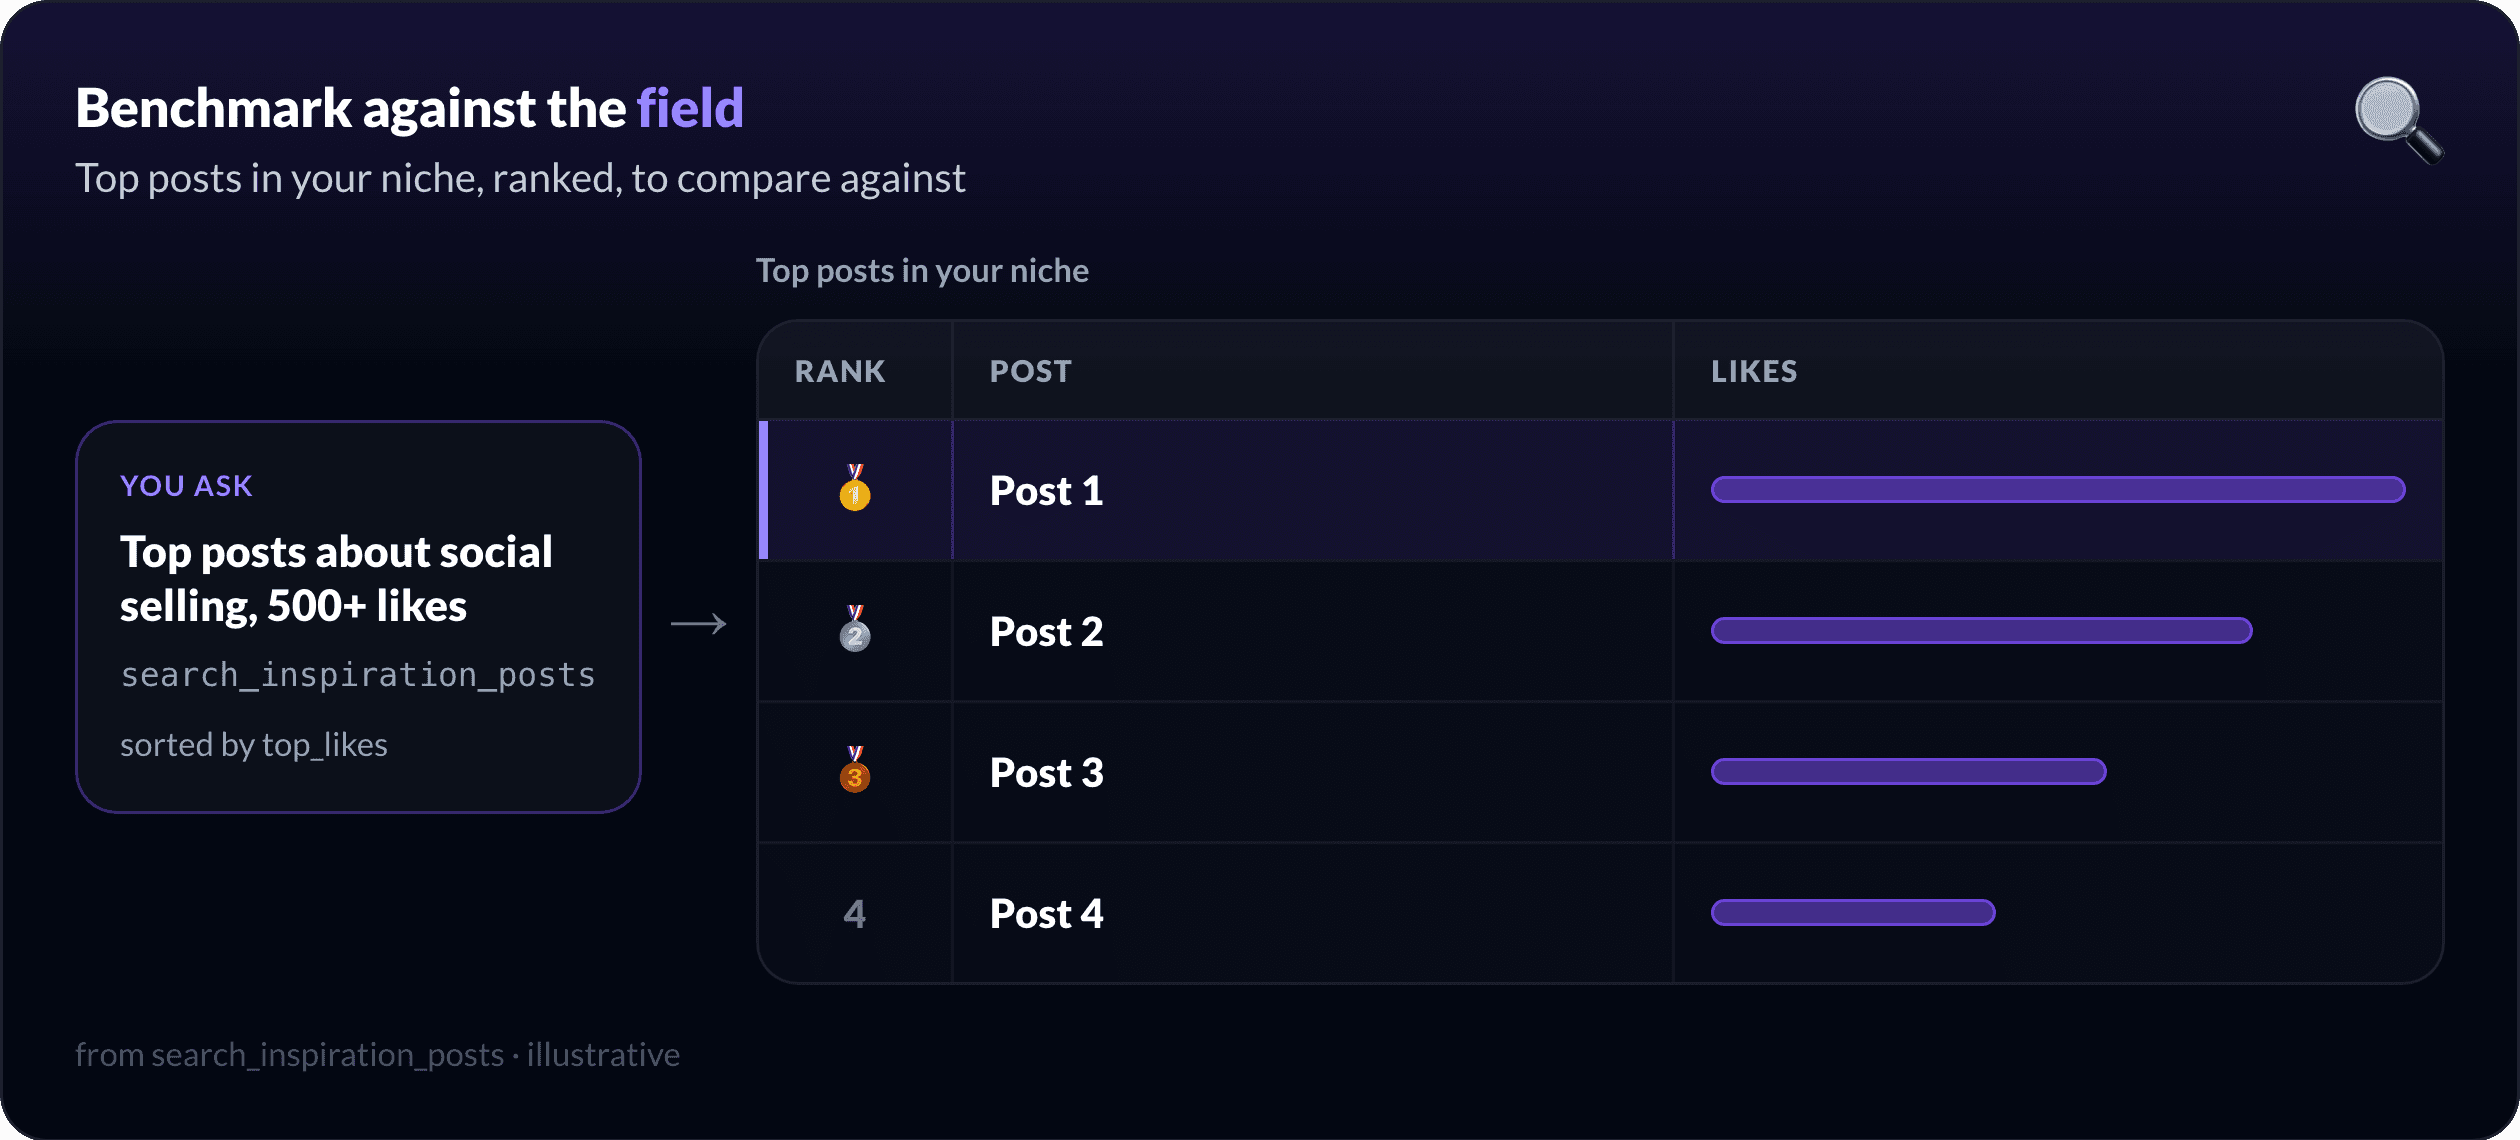
Your own totals tell you what happened. They do not tell you whether a number is strong for your topic. For that, you compare.
"Show me top-performing posts about social selling with at least 500 likes, sorted by top_likes."
`search_inspiration_posts` surfaces high-performing posts in your niche, filtered by engagement and sorted how you want, so "is 1,000 impressions good here?" becomes a question you can actually answer against the field, not in a vacuum.
Want the product view? LinkedIn analytics in MagicPost covers the full dashboard, audience breakdowns, and market benchmarks behind these numbers.
Why read analytics in chat at all?
Because it closes the loop. The place you measure is the place you write and schedule, so "what worked" turns straight into the next post instead of a tab you forget to open.
Draft in your voice, schedule it from chat, measure what landed, repeat. The LinkedIn MCP overview walks the whole loop end to end.
What about team or client analytics?
That is a different job: per-member summaries, a roster, and an API to feed your own dashboard. If you manage a team or clients, read managing multiple LinkedIn accounts via MCP; this guide stays on your own posts.
How do you set it up?
The MCP works in Claude Desktop, claude.ai, and Cursor. Connect once with your MagicPost token and the analytics tools appear alongside drafting and scheduling. Prefer to script it? The same actions are on the REST API at `api.magicpost.in/api/v1/*` with Bearer auth.
Everything stays scoped to your own account, with no cross-account access. Full reference: the developer docs and the MCP tools list.
See what your posts are doing, without leaving chat. Start with MagicPost: connect the MCP, ask how your month went, and turn the answer into your next post.
FAQ
Can you see LinkedIn analytics in Claude?
Yes. With the MagicPost MCP connected, `get_metrics_summary` returns your totals (impressions, likes, comments, reposts) and your top posts for a window like `30d`, straight in a Claude or Cursor chat.
What metrics does the MCP return?
Top-line totals, impressions, likes, comments and reposts, plus your top posts by impressions for the period you ask for. `refresh_my_posts` pulls fresh data before the summary if you need it current.
Can I compare my posts against others?
Yes. `search_inspiration_posts` surfaces high-performing posts in your niche, filtered by likes or comments and sorted how you want, so you can benchmark your own numbers against what actually performs.
Does this cover LinkedIn Ads analytics?
No. This is for your organic posts and their performance. It does not report on ad campaigns or spend.
Can I get analytics for my whole team?
That is the team and agency use case, with per-member summaries and an API for your own dashboard. See managing multiple LinkedIn accounts via MCP for that.

LinkedIn MCP Server: Manage Your Content in Claude
Connect MagicPost's MCP to Claude or Cursor and run your organic LinkedIn content end to end: write, schedule, measure, and manage your team, all from chat.

Schedule LinkedIn Posts From Claude (MCP)
LinkedIn's API only publishes now, never later. See how MagicPost's MCP lets you schedule and queue LinkedIn posts at the right time, from Claude or Cursor.

Manage Multiple LinkedIn Accounts via MCP & API
Run an agency or team's LinkedIn from one place: read each account's metrics, schedule on their behalf, and build your own dashboard via MCP and API.