LinkedIn Benchmark · October 2026

In October, LinkedIn impressions are climbing again.

A typical post got 623 impressions, +6% in a month. 19 of the 28 benchmarks are up.

Naïlé Titah, CEO of MagicPost · November 10, 2026

For months, this benchmark mostly brought you red arrows. In October, most benchmarks turned green again: from 0 to 25K followers, the typical post gained between 6% and 16%.

And a trend is taking shape behind it: text-only posts are bouncing back.

Get the LinkedIn Benchmark every month

Month by month

The biggest rise since January

Median impressions per post, November 2025 to October 2026.

667NovNovember 2025 · 667 · −8%2025−8%613DecDecember 2025 · 613 · −8%−8%668JanJanuary 2026 · 668 · +9%2026+9%678FebFebruary 2026 · 678 · +2%+2%656MarMarch 2026 · 656 · −3%−3%655AprApril 2026 · 655 · 0%0%617MayMay 2026 · 617 · −6%−6%599JunJune 2026 · 599 · −3%−3%609JulJuly 2026 · 609 · +2%+2%614AugAugust 2026 · 614 · +1%+1%589SepSeptember 2026 · 589 · −4%−4%623OctOctober 2026 · 623 · +6%+6%

In the badges: the change from the previous month.

The dip

In spring, reach for the same creators was down about 10% from mid-March to May. Polls fell below the average post, and carousels over 10 pages lost 25% in April. In late July, LinkedIn started seriously penalizing posts that ask you to comment a keyword, along with so-called “AI slop” posts.

The rebound

Since late September, a trend has been taking shape: text-only posts are bouncing back. We’ll keep an eye on it in November…

Trend of the month

Text-only posts are bouncing back

Impressions of a text-only post vs a post with an image, from the same creator, month by month.

+56%Oct 2026, text-only vs image

+50%+25%−15%0on par with images+16%+56%Jul 2024Jan 2025Jul 2025Jan 2026Oct 2026Jul 2024, text-only vs image, −12%Aug 2024, text-only vs image, −14%Sep 2024, text-only vs image, −13%Oct 2024, text-only vs image, −11%Nov 2024, text-only vs image, −3%Dec 2024, text-only vs image, −3%Jan 2025, text-only vs image, +1%Feb 2025, text-only vs image, +4%Mar 2025, text-only vs image, 0%Apr 2025, text-only vs image, −3%May 2025, text-only vs image, −4%Jun 2025, text-only vs image, +1%Jul 2025, text-only vs image, −4%Aug 2025, text-only vs image, +1%Sep 2025, text-only vs image, −5%Oct 2025, text-only vs image, −1%Nov 2025, text-only vs image, 0%Dec 2025, text-only vs image, +2%Jan 2026, text-only vs image, +1%Feb 2026, text-only vs image, +6%Mar 2026, text-only vs image, −6%Apr 2026, text-only vs image, −9%May 2026, text-only vs image, −4%Jun 2026, text-only vs image, +1%Jul 2026, text-only vs image, 0%Aug 2026, text-only vs image, −7%Sep 2026, text-only vs image, +16%Oct 2026, text-only vs image, +56%

For two years, a text-only post and a post with an image did about the same for any given creator. Since late September, the gap has been widening: +16% impressions in September, +56% in October. Likes and comments are growing much less.

To be confirmed in the coming weeks.

What moved in October

Up to 25K followers, the typical post is up

Median impressions per follower bracket, October vs September.

The only bracket going down: 50K-100K followers, at −14%. It has few creators, and for the same authors the gap isn’t significant.

By follower count

The full table

From 214 impressions per post for accounts with 0-1K followers to 11,134 for 100K+. Low, median, high and top 10% of posts, and how they changed vs September.

Impressions per post by follower count · October 2026
FollowersLowMedianHighTop 10%Posts
0-1K96+13%214+10%524+7%1,389+14%2,539
1K-5K190+7%444+6%1,133+1%3,450+4%10,917
5K-10K375+19%891+16%2,442+17%8,339+27%5,499
10K-25K540−1%1,500+6%4,660+16%15,385+19%5,259
25K-50K1,091+2%2,9820%10,072+13%33,045+37%3,426
50K-100K2,194−16%5,668−14%16,252−5%41,466−7%1,403
100K+3,886−16%11,134+6%30,324−4%86,393−20%953

Low = 25th, median = 50th, high = 75th, top 10% = 90th.

By country

United Kingdom and United States grew the most

Median impressions per post. All countries combined: 623.

United Kingdom+90% impressions vs all countries1,186+22%
United States+81% impressions vs all countries1,125+19%
Germany+63% impressions vs all countries1,016+6%
France+23% impressions vs all countries765+3%
India−52% impressions vs all countries301−10%

Our studies: where do they stand?

Our findings: do they still hold?

What we’ve measured over the past few months, with each creator compared with their own posts. The links figure is from October.

Comment bait

Still true

“Comment GUIDE to get it”

Before July 27+9%
Since July 27−52%
−52%

AI slop

Still true

Posts with no concrete detail or lived experience

No substance, before summer−13%
No substance, since then−23%
“AI” phrasing in the text−9%
−23%

Links

Still true

An external link in the post, vs their posts without one

Link only, with preview card−23%
Image + URL in the post−19%
−20%

Visuals

New study

The image that goes with the post, vs their other visuals

Photo with several people+31%
Event or podcast announcement visual−28%
Image that’s mostly text−26%
+31%

Your personal benchmark

So how are your posts doing?

MagicPost compares each of your posts with accounts your size, and tells you every month whether you’re above or below.

See where I stand →
Bonus

The posts that took off in October

Posts that got more than 100 times their author’s usual reactions. Each one tells a real, concrete story, with an image that speaks for itself.

Career722× their usual reactions

Hired on the third try

20,222 reactions, from an author who usually gets 28.

Why it works

Three dated lines tell the whole story before “see more”, and the photo shows her pointing at the Kaiser Permanente sign.

Dr. Dayna Scott Vidal, DNP, RN, CPHQ, CPPSI am a nursing executive who helps…

2015: Applied to KP. No response.
2024: Applied to KP. Response. No interview.
2026: Applied to KP. Response. Interview. HIRED! …more
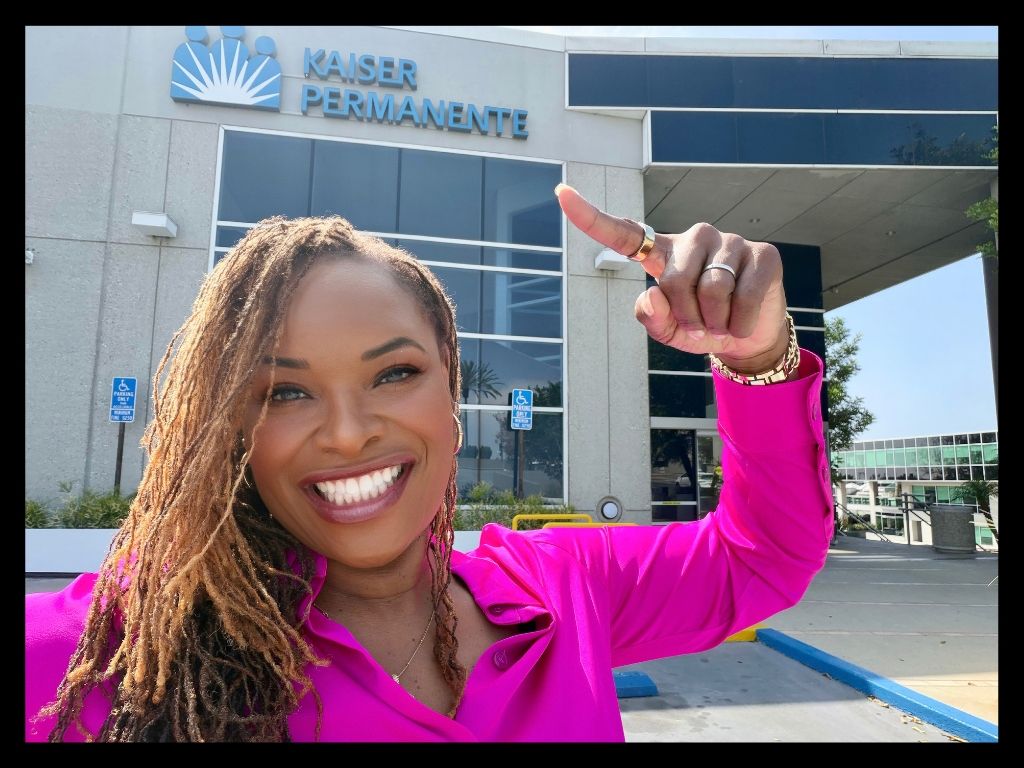
👍👏❤️20,2221,332 comments · 73 reposts
October 2026

In October

What moved this month, against September.

Each creator against their own posts.

The biggest post of October reached 2,447,024 impressions, from an account with 25K-50K followers

View post ↗
2,447,024Image post · 25K-50K followers

Get the LinkedIn Benchmark every month

Around the 8th of each month: the new medians, what moved for your follower count, and the infographic.

Free. Unsubscribe in one click.

The October infographic

This month's complete benchmark, in your colors, ready to post on LinkedIn.

Month over month

The last 12 months, November 2025 to October 2026.

Nov 2025–Oct 2026

Each issue analyzes between 18,784 and 37,646 public posts: 29,996 in October.

Posts in each issue's sample.

A month keeps growing after it is published

May574 → 617+7%
Jun539 → 599+11%
Jul561 → 609+9%
Aug575 → 614+7%
Sep572 → 589+3%
Oct · provisional623 → ?next issue

Median impressions when the issue came out, and today. Posts keep collecting impressions, and late posts join the sample.

The long run

Every public post we have tracked since 2024.

Formats2024–2026

Carousels went from +42% vs the author's median in 2024 to +4% in 2026

202420252026
Share of all postsImage 58%Text 17%Video 10%Article 8%Carousel 6%Poll 1%

Reach vs the author's median (100 = their median).

Links

A link preview card costs 51% to 72% of reach

no linklink in the textlink preview card

Median impressions by follower bracket. 275,526 posts.

Length

Reach peaks between 150 and 200 words

Reach score by post length in words, all formats (100 = best length). 1,154,171 posts.

Frequency

The more often you post, the less each post gets: +66% vs peers at 1/week, −20% at 8–10/week

Reach per post vs accounts of the same size. 15,078 creators. Total weekly reach still rises with frequency.

Engagement

A typical post gets 2% engagement; the top 10% start near 7%

half of postsmediantop 10%

(Likes + comments) / impressions. 28,975 posts.

Topics

“LinkedIn” was the most-posted topic in October

LinkedIn
1,581
Leadership
1,096
Artificial Intelligence Ethics
923
Mental Health
710
Career Development
654

Posts per topic in October.

Every issue

One issue per month, archived at its own address.

Method

Sample
Public LinkedIn posts published during the month by creators with 100+ followers, with impression data.
Brackets
Seven follower brackets, from under 1K to 100K+. A bracket needs 50+ posts.
Percentiles
Low = 25th, median = 50th, high = 75th, top 10% = 90th.
What worked
Each creator against their own other posts, published only when the effect holds.
Refresh
One issue a month, around the 8th, for the previous month.

Questions

How many impressions does a LinkedIn post get?

Median impressions were 623 per post in October 2026, across 29,996 public posts: 214 under 1K followers, 11,134 above 100K.

What is a good number of impressions on LinkedIn?

Above your bracket's median, a post beats half of comparable posts: 444 with 1K-5K followers. The top 10% starts at 3,450 for that bracket.

What is a good engagement rate on LinkedIn?

About 2% for a typical post (likes and comments divided by impressions). The top 10% of posts start near 7%.

Cite this benchmark

MagicPost LinkedIn Benchmark, Issue 10, October 2026. https://magicpost.in/linkedin-benchmark/october-2026

Which profile describes you best?

These two answers pre-fill your booking.