Most agencies do not lack LinkedIn data. They have eight dashboards, a monthly deadline, and no defensible way to say which client had a good month.
The hard part of LinkedIn analytics for agencies is reading two clients on the same page without the smaller audience looking like a failure. This guide covers the grid, the comparability rules, the review routine and the recommendations that come out of it.
What should an agency measure for each LinkedIn client?
Start from the objective, not the metric. A client who wants inbound leads and a client who wants recruiting visibility need different numbers, and reporting the same six charts to both is how reports stop being read.
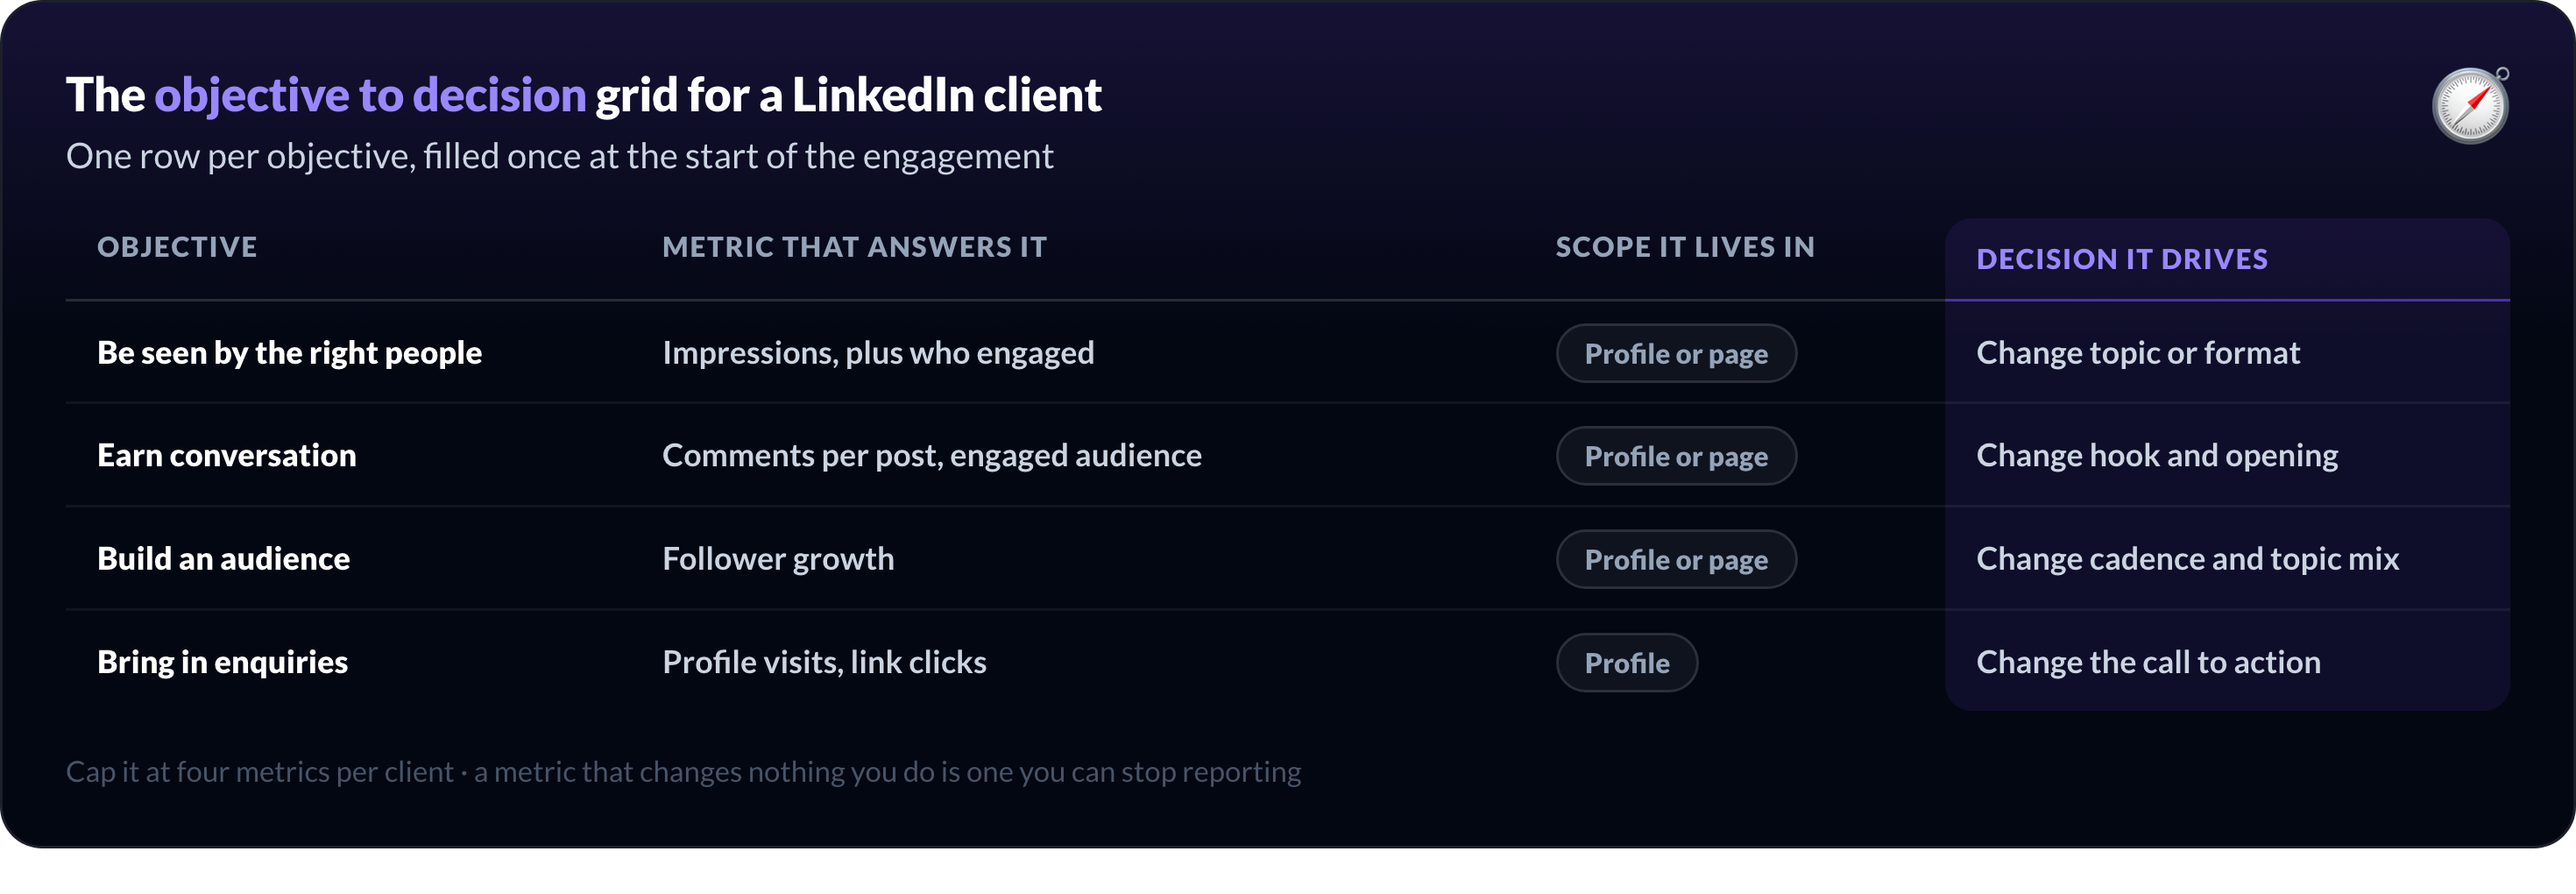
Fill one row per client, once, at the start of the engagement:
Objective | Metric that answers it | Scope it lives in | Decision it drives |
Be seen by the right people | Impressions, plus who engaged | Profile or page | Change topic or format |
Earn conversation | Comments per post, engaged audience | Profile or page | Change hook and opening |
Build an audience | Follower growth | Profile or page | Change cadence and topic mix |
Bring in enquiries | Profile visits, link clicks | Profile | Change the call to action |
The fourth column is the one agencies skip, and it is the one that makes the report worth reading. A metric that changes nothing you do is a metric you can stop reporting.
Two habits keep the grid usable. Cap it at four metrics per client, because a report with fourteen numbers has no argument in it. And write the objective in the client's words, from the kickoff call, so the report answers the question they actually asked.
How to compare LinkedIn analytics across agency clients fairly
Five things have to match before two clients can be compared, and they rarely do.
Same period. Compare four full weeks against four full weeks. A month with a public holiday and a month without are different months, and a thirty-one-day month against a twenty-eight-day one inflates every total by roughly a tenth.
Same posting volume. Total impressions rise with the number of posts. If one client published twelve times and the other four, compare impressions per post or you are measuring effort, not performance.
Same audience size. A post from an account under 1,000 followers takes a median of 225 impressions, while an account above 100,000 takes 12,111, measured across 566,957 posts with synced analytics in our LinkedIn benchmark.
Two clients that far apart do not share a scale, so use rates rather than counts and read each one against its own band.
Same account type. A personal profile and a company page have different reach mechanics and different metrics available. Comparing a client's page to another client's profile compares two different products.
Same definition of engagement. Decide whether engagement means reactions, or reactions plus comments plus shares, and apply it to everyone. Native LinkedIn and third-party tools do not all count the same events.
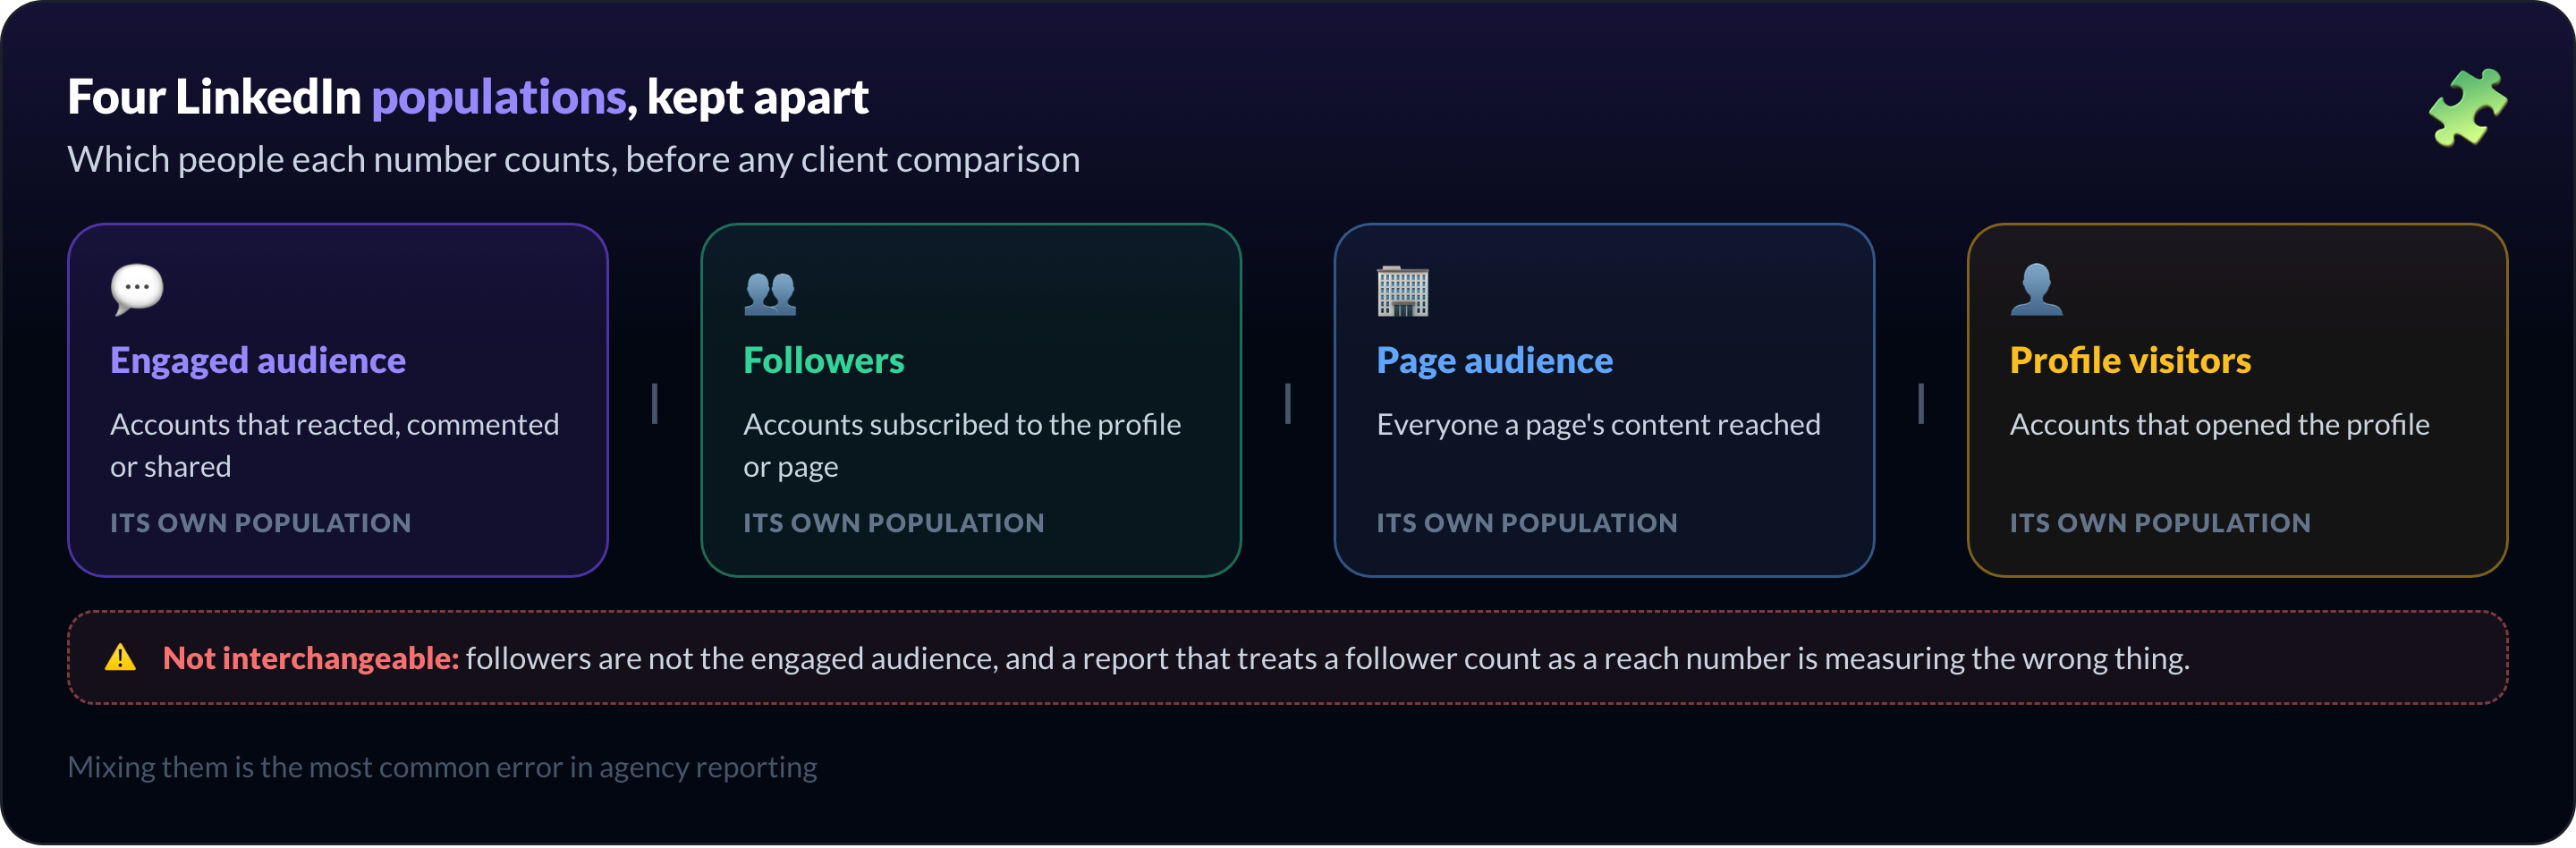
The four populations behind those rules are distinct, and mixing them is the most common error in agency reporting:
Engaged audience: accounts that reacted, commented or shared
Followers: accounts subscribed to the profile or page
Page audience: everyone a page's content reached
Profile visitors: accounts that opened the profile
Followers are not the engaged audience, and a report that treats a follower count as a reach number is measuring the wrong thing. Which advanced metrics and exportable columns you get depends on the scope and on the permissions attached to the account.
Where an external reference is useful, our LinkedIn benchmark gives median impressions by band rather than an average across everyone, which is the comparison a small client actually deserves. For the definitions themselves, the LinkedIn analytics guide covers every metric.
How to build an agency LinkedIn analytics workflow
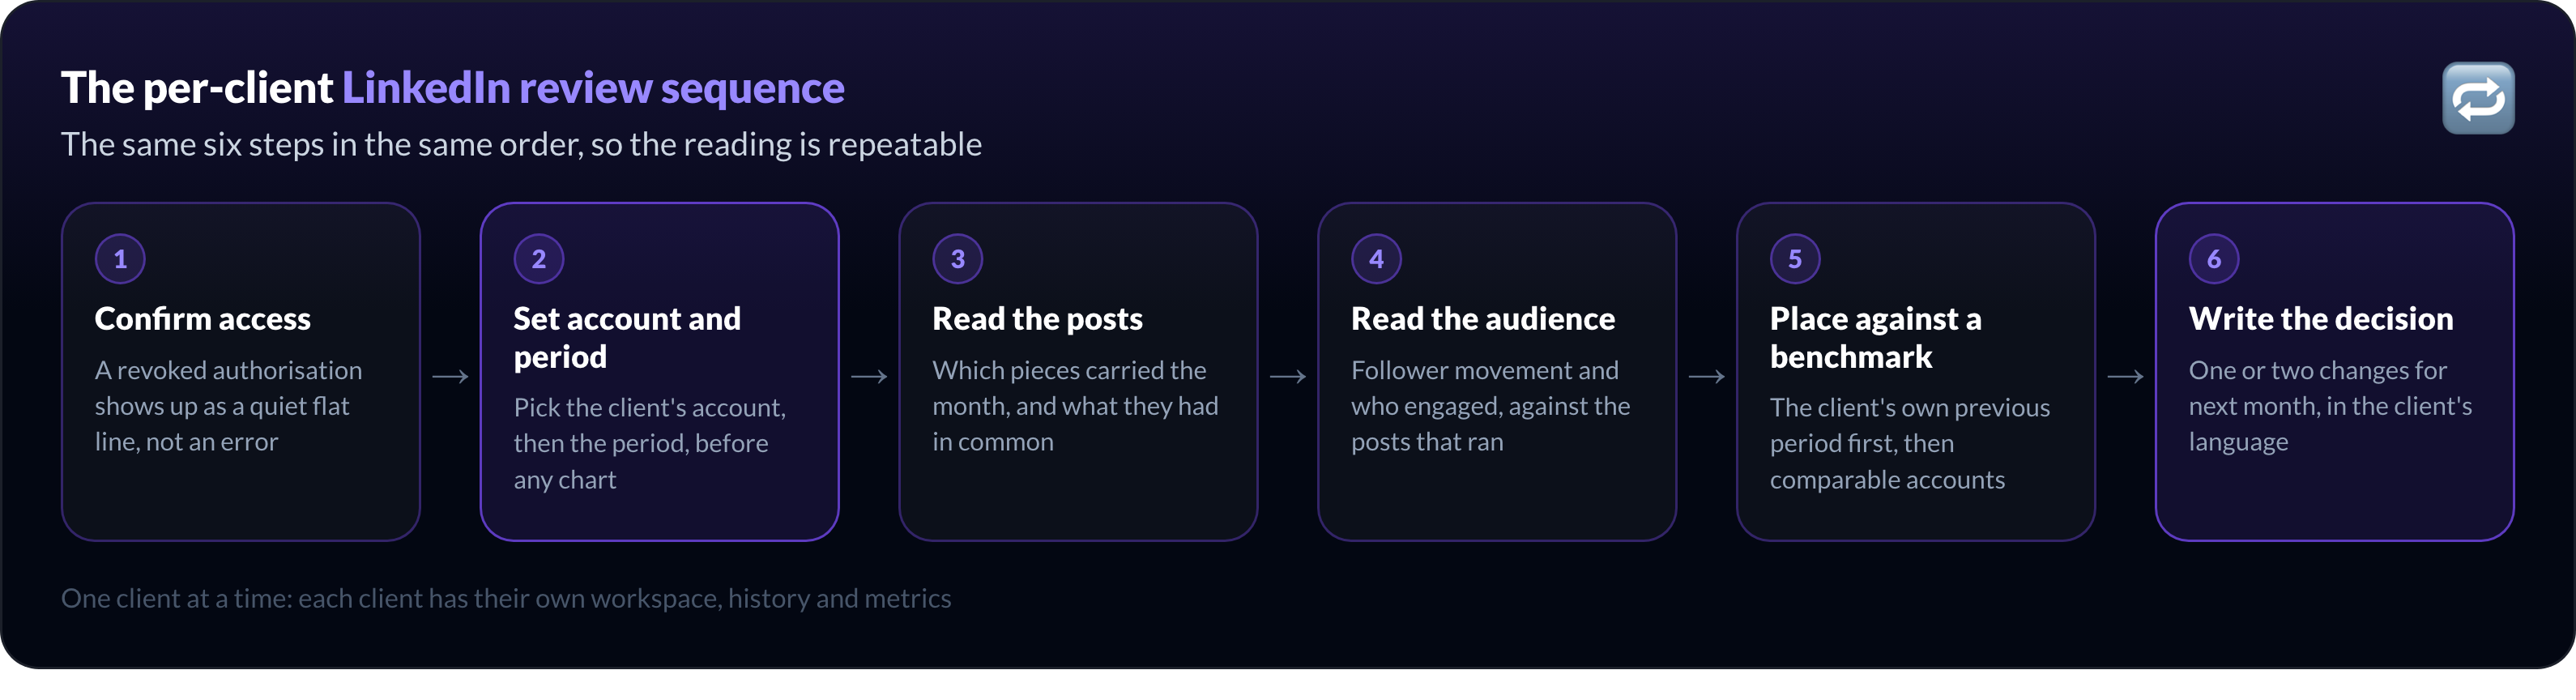
Run the same sequence per client, in the same order, so the reading is repeatable rather than improvised.
Confirm access. A revoked authorisation shows up as a quiet flat line, not as an error.
Set account and period. Pick both before you look at a single chart, so every panel shares them.
Read the posts. Which pieces carried the month, which did nothing, and what they had in common.
Read the audience. Follower movement and who engaged, against the posts that ran.
Place it against a benchmark. Compare to the client's own previous period first, then to a band of comparable accounts.
Write the decision. One or two changes for next month, in the client's language.
Note what step two implies. You are working in one client's dashboard, on that client's period, and MagicPost is built that way: each client has their own workspace, their own history and their own metrics, and a branded report is produced from that client's own Reports section.
For diagnosis, one client at a time is the right unit. Cross-client comparison is a separate exercise, done deliberately with the five rules above, on a small sheet of your own.
Do not expect a tool to print it for you, and be sceptical of one that offers to: an aggregate across unrelated clients with different audiences and objectives is a number with no meaning.
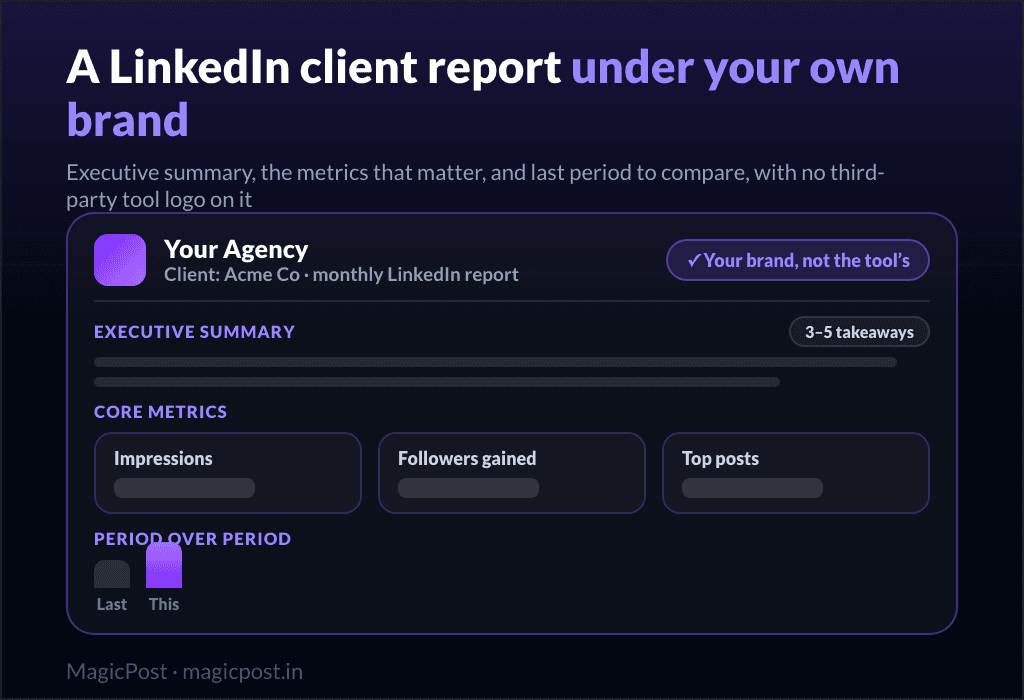
The report itself, its structure, and delivering it under your own brand are covered in white-label LinkedIn reports.
How to turn LinkedIn analytics into client recommendations
Three shapes cover most months. The examples below are illustrative patterns, not measured client results.
Reach moved, engagement did not. More people saw the posts and the same few responded. Usually a distribution change rather than a content one, so the recommendation is about the opening: the post is reaching people and not holding them. Check whether the posts that travelled carried a preview card.
Engagement moved, reach did not. A smaller audience is responding harder. This is the healthiest of the three, and the recommendation is to publish more of that thing rather than to change anything.
Audience moved, neither of the others did. Followers arrived and nothing else changed. Often a single post travelled outside the usual audience. The recommendation is to check who arrived before writing for them.
Name the scope every time, because "engagement is up" means nothing without knowing whether it is the page or the profile. And give one change, not five: a report with five recommendations is a report where nothing gets done.
What should a LinkedIn analytics tool offer an agency?
Five requirements to check before you commit to a tool.
Per-account depth, not just a follower count
Named populations, kept separate in the interface
Export, so the numbers leave the dashboard
Multi-account access, one login across the roster
A client-ready report, under your brand
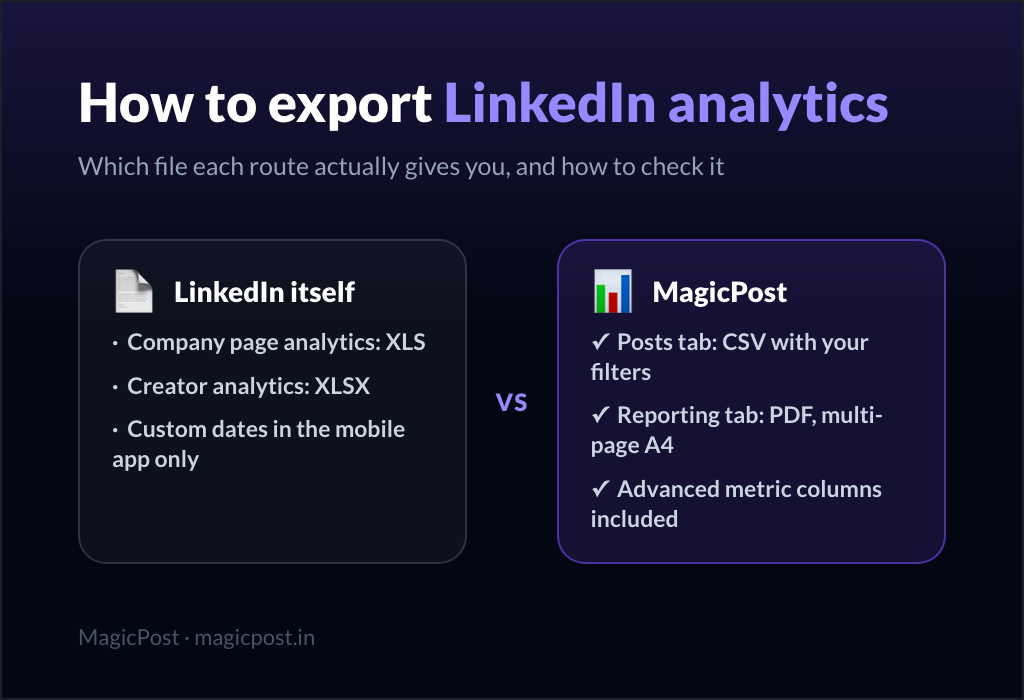
Export is the one agencies underrate. Any comparison across clients happens in a spreadsheet, which means a tool without a usable export forces you to retype numbers into a deck once a month. The routes and the actual file formats are in how to export LinkedIn analytics.
For the market view rather than the method, the best LinkedIn analytics tools compares what each one measures, and the best LinkedIn tools for agencies covers the wider stack.
Track every client's LinkedIn analytics with MagicPost
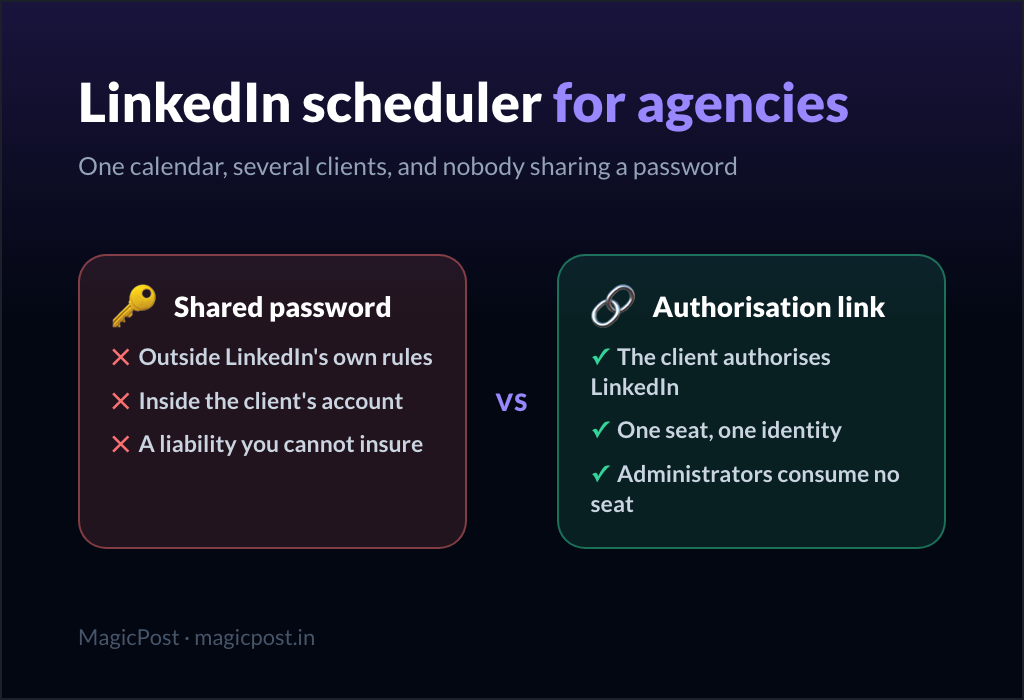
Running the calendar behind those numbers is the other half of the job: LinkedIn scheduler for agencies covers the publishing setup, and MagicPost for agencies covers the plan itself.
Give every client their own dashboard, and yourself one place to work from. MagicPost reads each client's metrics through LinkedIn's official API with no extension, and keeps every client's history in their own workspace.
Reports come out under your logo and colours, from each client's own Reports section, plus CSV for the analysis you do yourself. Agency plan, per seat, two seats minimum, priced on request. Free trial, no credit card.
FAQ
Can an agency see LinkedIn analytics for a client's page and profile?
Yes, an agency reads a client's page analytics and profile analytics, but the two are separate scopes and each is read on its own. A personal profile and a company page have different metrics available and different reach mechanics, so each takes its own seat and its own dashboard.
Reporting them as one number hides which of the two actually moved, which is usually the finding worth reporting.
Can you measure a LinkedIn account you are not connected to?
No, LinkedIn analytics require authorised access to the account, so an account you are not connected to cannot be measured properly. That is why the first step of any client review is confirming the connection is still live.
Public activity is the exception, and MagicPost reads it in the same dashboard through LinkedIn competitor analysis. Point it at any indexed profile and you get every post in the period with its likes and comments, their formats, their themes and their best posts ranked.
That covers a competitor's cadence and what works for them. It never covers their impressions, follower movement or click data, which stay private to the account owner.
How do you benchmark a small client against a large one?
Benchmarking a small LinkedIn client against a large one starts with never comparing their totals. Use rates rather than counts, compare each client to their own previous period first, then to a band of accounts their size.
Our LinkedIn benchmark publishes median impressions by band for exactly this reason: an average across all account sizes flatters large accounts and makes every small client look like a problem.
What period should an agency compare on LinkedIn?
An agency compares four full weeks against the four full weeks before, kept identical across clients. Calendar months are convenient for invoicing and misleading for analysis, because month lengths differ and holidays land unevenly. Whatever you pick, apply it to the whole roster, and set the period before reading any chart rather than after.
How should an agency prepare a LinkedIn client report?
Work from the client's objective, keep it to about four metrics, name the scope on every number, and end on one recommendation rather than five.
Produce the document from that client's own dashboard so the figures match what they would see themselves, and export the raw table alongside it when the client wants to check the arithmetic.