Exporting LinkedIn analytics sounds like one task. It is four, and picking the wrong one costs you an afternoon of retyping.
The route depends on whose account it is, who the file is for, and whether you need numbers you can sort or a document someone can read. This guide covers each route, the file it actually produces, and the checks that catch a bad export before it reaches a client.
Which LinkedIn analytics can you export?
Two accounts, two products, and they behave differently.
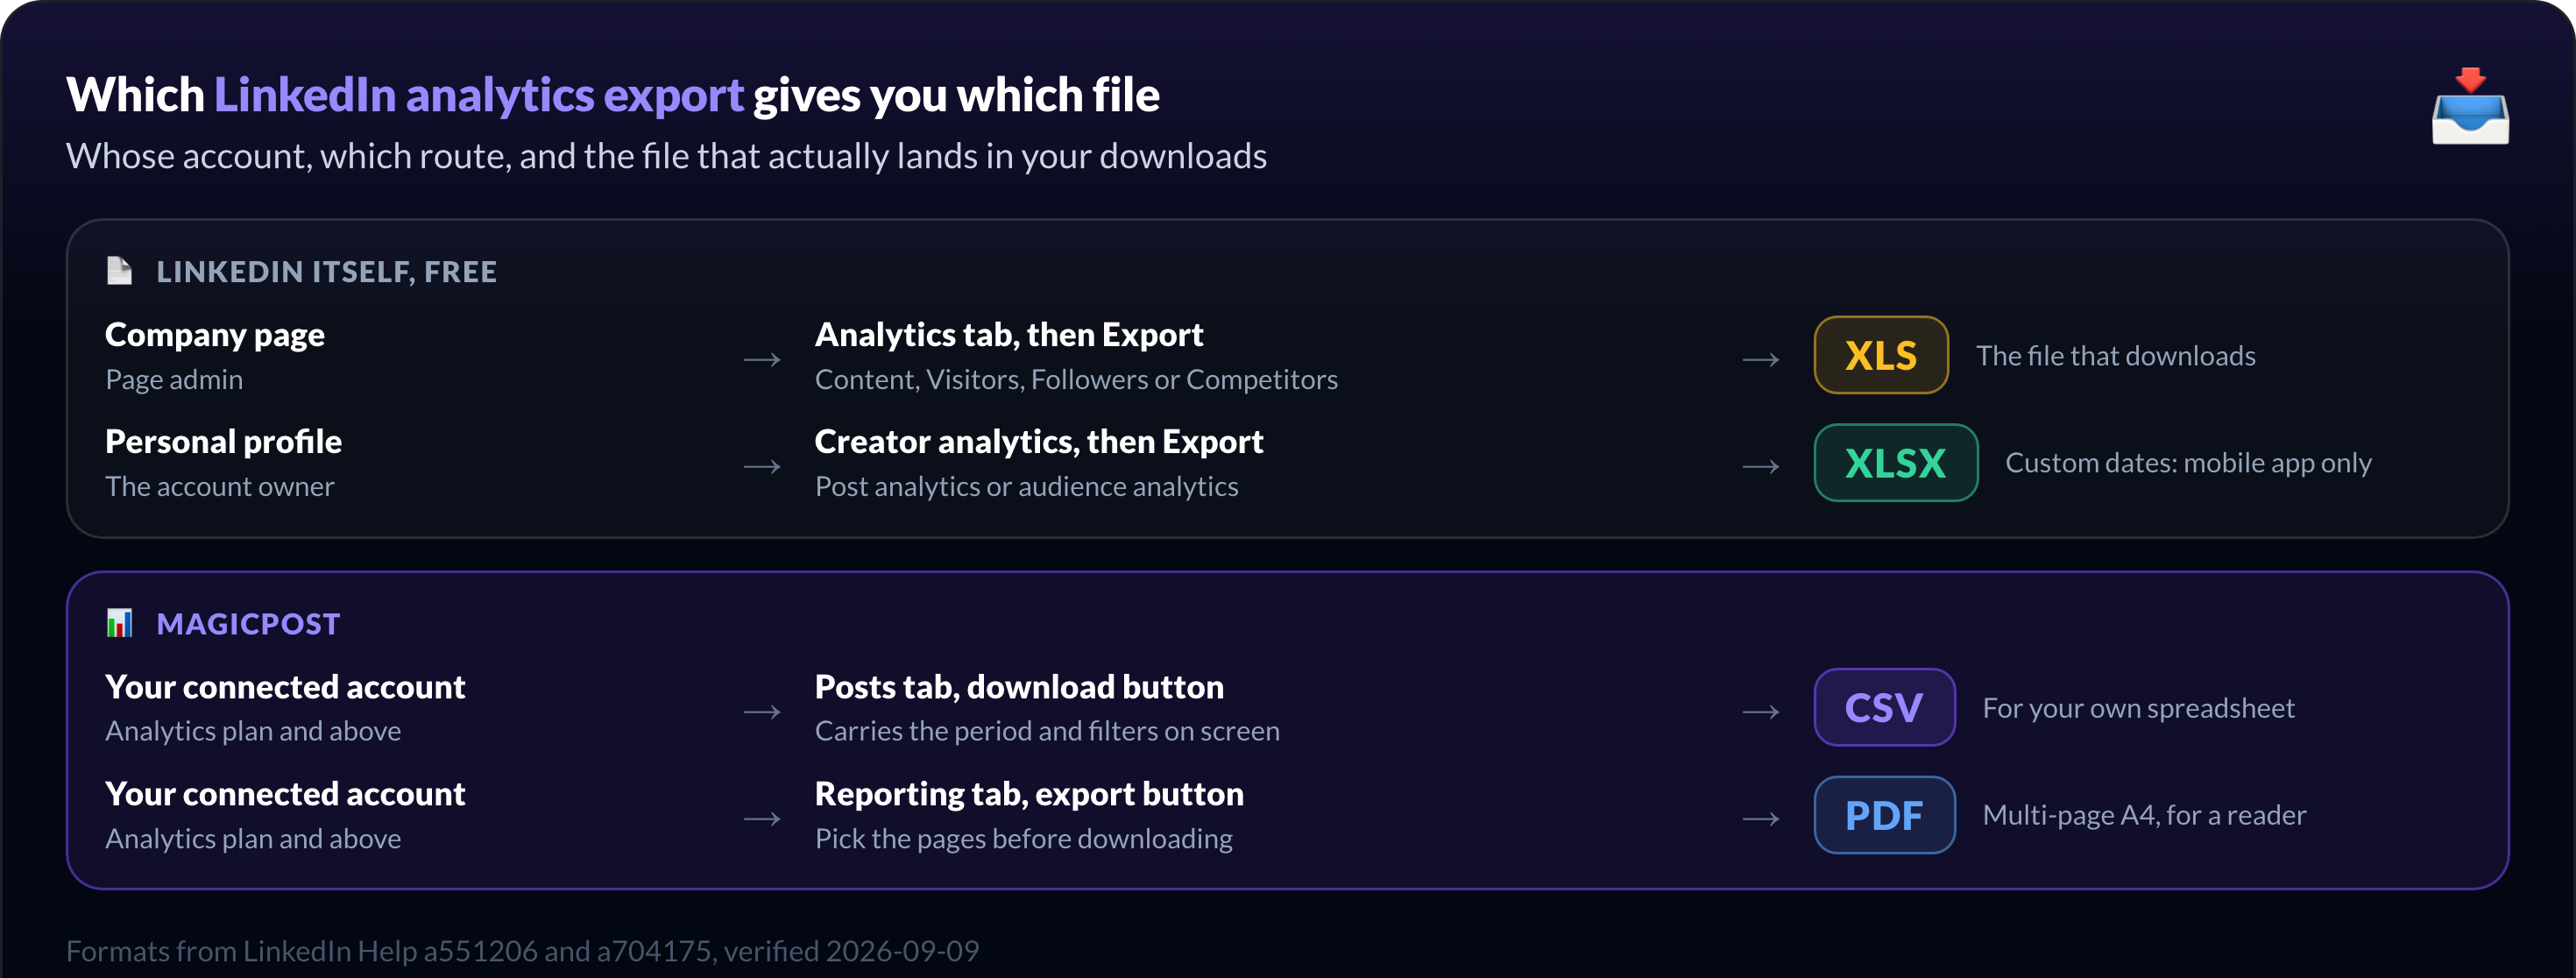
A company page exports from its Analytics tab, and the export covers the tab you are on: Content, Visitors, Followers or Competitors. It is a Page admin action.
A personal profile exports its creator analytics, covering combined post analytics and audience analytics. Post analytics span short-form posts, images, videos, events, polls and articles.
The file formats are the part everyone gets wrong, including several pages ranking for this query. LinkedIn's own help center is unambiguous on them:
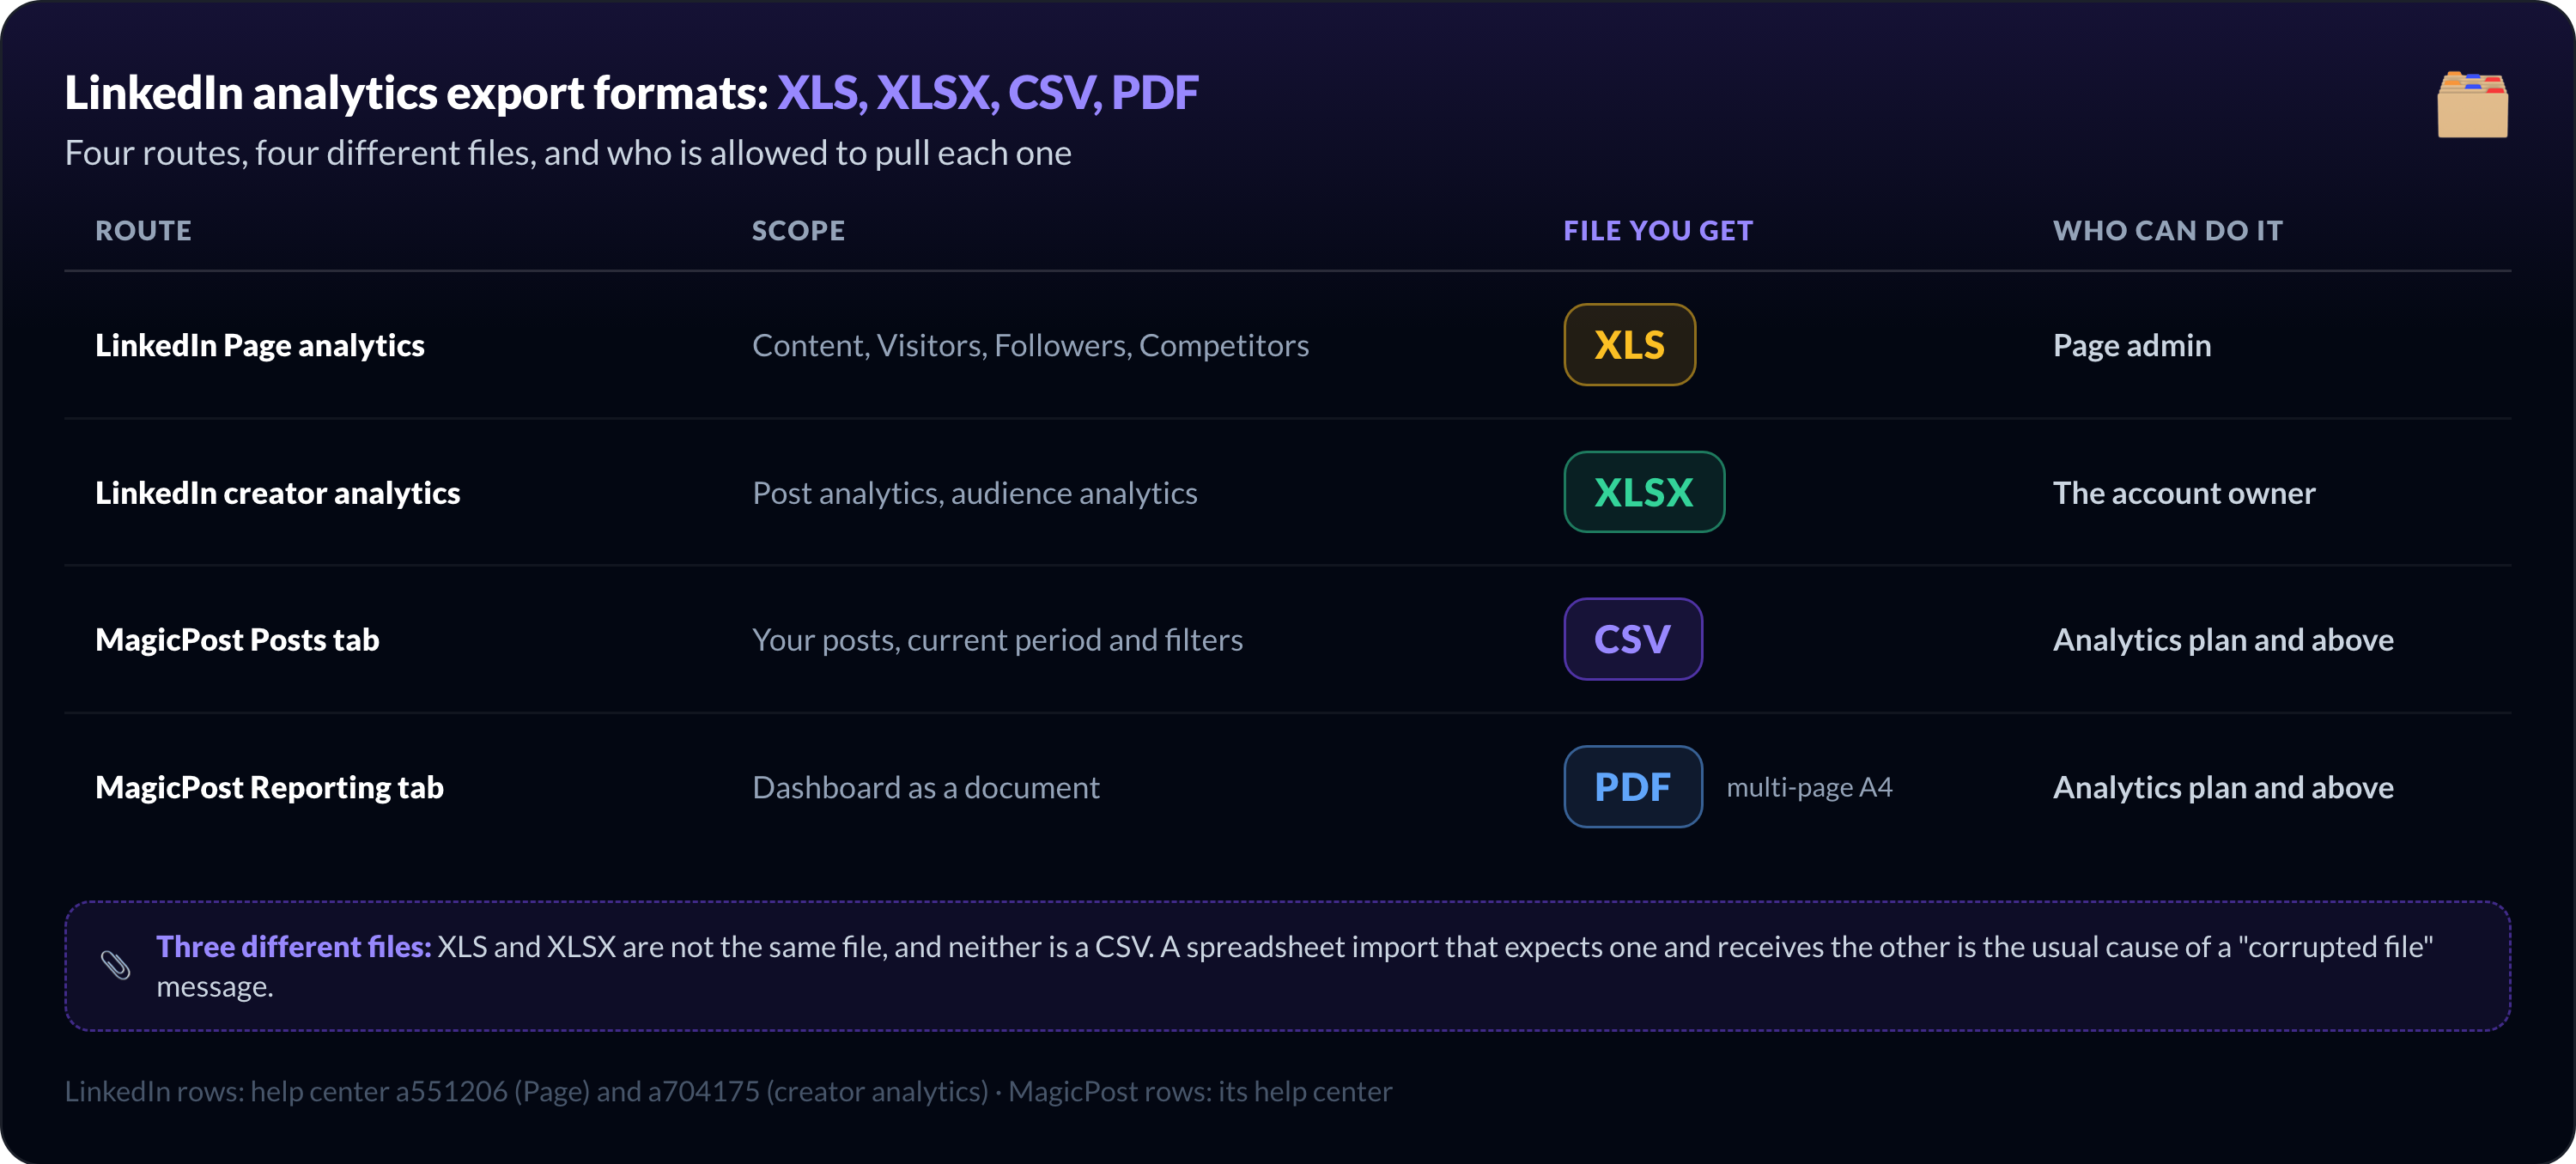
Route | Scope | File you get | Who can do it |
LinkedIn Page analytics | Content, Visitors, Followers, Competitors | XLS | Page admin |
LinkedIn creator analytics | Post analytics, audience analytics | XLSX | The account owner |
MagicPost Posts tab | Your posts, current period and filters | CSV | Analytics plan and above |
MagicPost Reporting tab | Dashboard as a document | PDF, multi-page A4 | Analytics plan and above |
XLS and XLSX are not the same file, and neither is a CSV. It matters when a script or a spreadsheet import expects one and receives the other, which is the usual cause of a "corrupted file" message that is not corruption at all.
There is a third native route worth naming: the Pages Data Portability API, for Page owners and their authorised developers. LinkedIn's page on it has not been updated in three years and documents no format or limit, so treat it as an existing access path rather than a reporting option.
How to export analytics from LinkedIn itself
From a company page, in the Page admin view: open Analytics in the left menu, pick the tab you want, click Export in the upper-right corner, choose the timeframe, and confirm. The XLS file downloads.
From a personal profile, open your creator analytics and click Export in the upper-right corner. You get an XLSX file covering the analytics view you are on, post analytics or audience analytics.
One limitation that catches people out and that no other guide on this query mentions: custom date range selection is only available in the LinkedIn mobile app. On desktop you are choosing from the dropdown ranges LinkedIn offers.
If your reporting period does not match one of them, you either export from your phone or export a wider range and trim it in the spreadsheet.
Two more details on the profile side. The date range you pick applies to the new-followers graph and the top-demographics section, not to the total follower count at the top, which is a live number.
Creator analytics also belong to the account owner, so the export covers your own account only: another creator's profile shows you their public activity, with no analytics view behind it.
How to export LinkedIn analytics from MagicPost
MagicPost's two exports do different jobs.
CSV, from the Posts tab. MagicPost's download button exports the table exactly as you left it: the period you selected, the filters you applied, and every metric column including the advanced ones, meaning unique views, saves, link clicks, profile clicks and premium CTA clicks.
The filters being part of the export is the useful part. Filter the table to carousels over the last ninety days, then export, and the CSV holds carousels over the last ninety days. Use it for your own spreadsheets and any analysis the charts do not cover.
PDF, from the Reporting tab. MagicPost's export button builds a multi-page A4 document from your dashboard. You preview it before downloading and choose which pages to include: the reporting overview, and optionally your Audience and Benchmarks pages.
The report carries the period selected in the dashboard, so ninety days on screen is ninety days on paper.
You can change the accent colour of the charts to match a brand before exporting, from the colour picker beside the export button. That control needs the Creator plan; the exports themselves come with the Analytics plan.
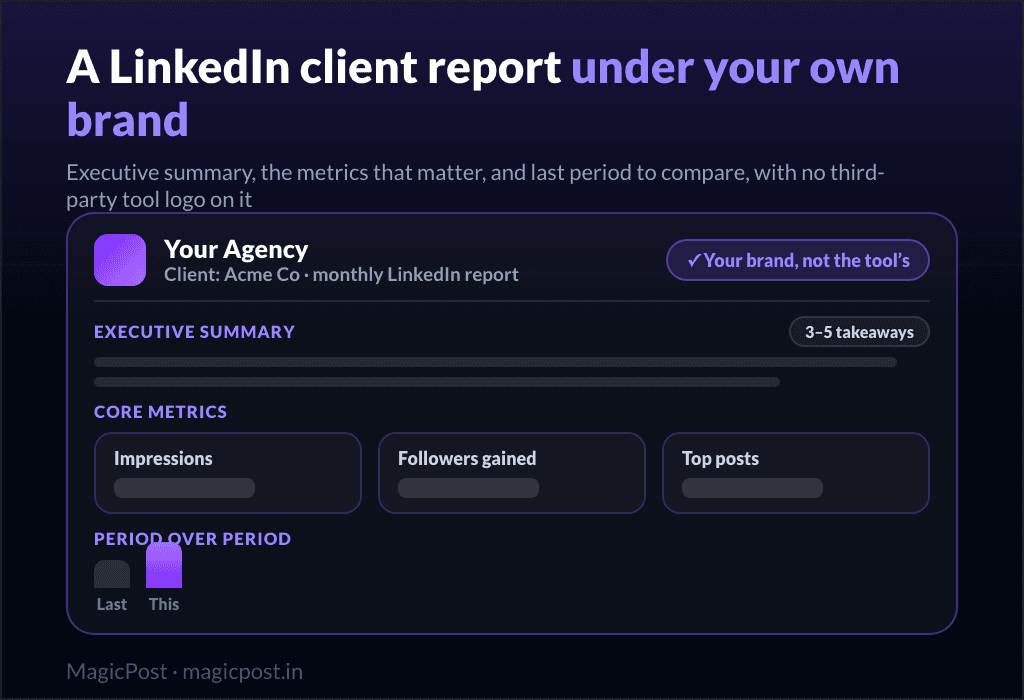
If you manage clients, the Agency plan takes the PDF further with white-label reports from each client's Reports section, under your logo and colours, plus CSV. The interface detail lives in the help center article on how to export your LinkedIn metrics.
What none of this does is send itself. There is no scheduled export today. For programmatic access to your data, the API is the route; it is not a way to have a PDF arrive in an inbox every Monday.
How to check a LinkedIn analytics export before using it
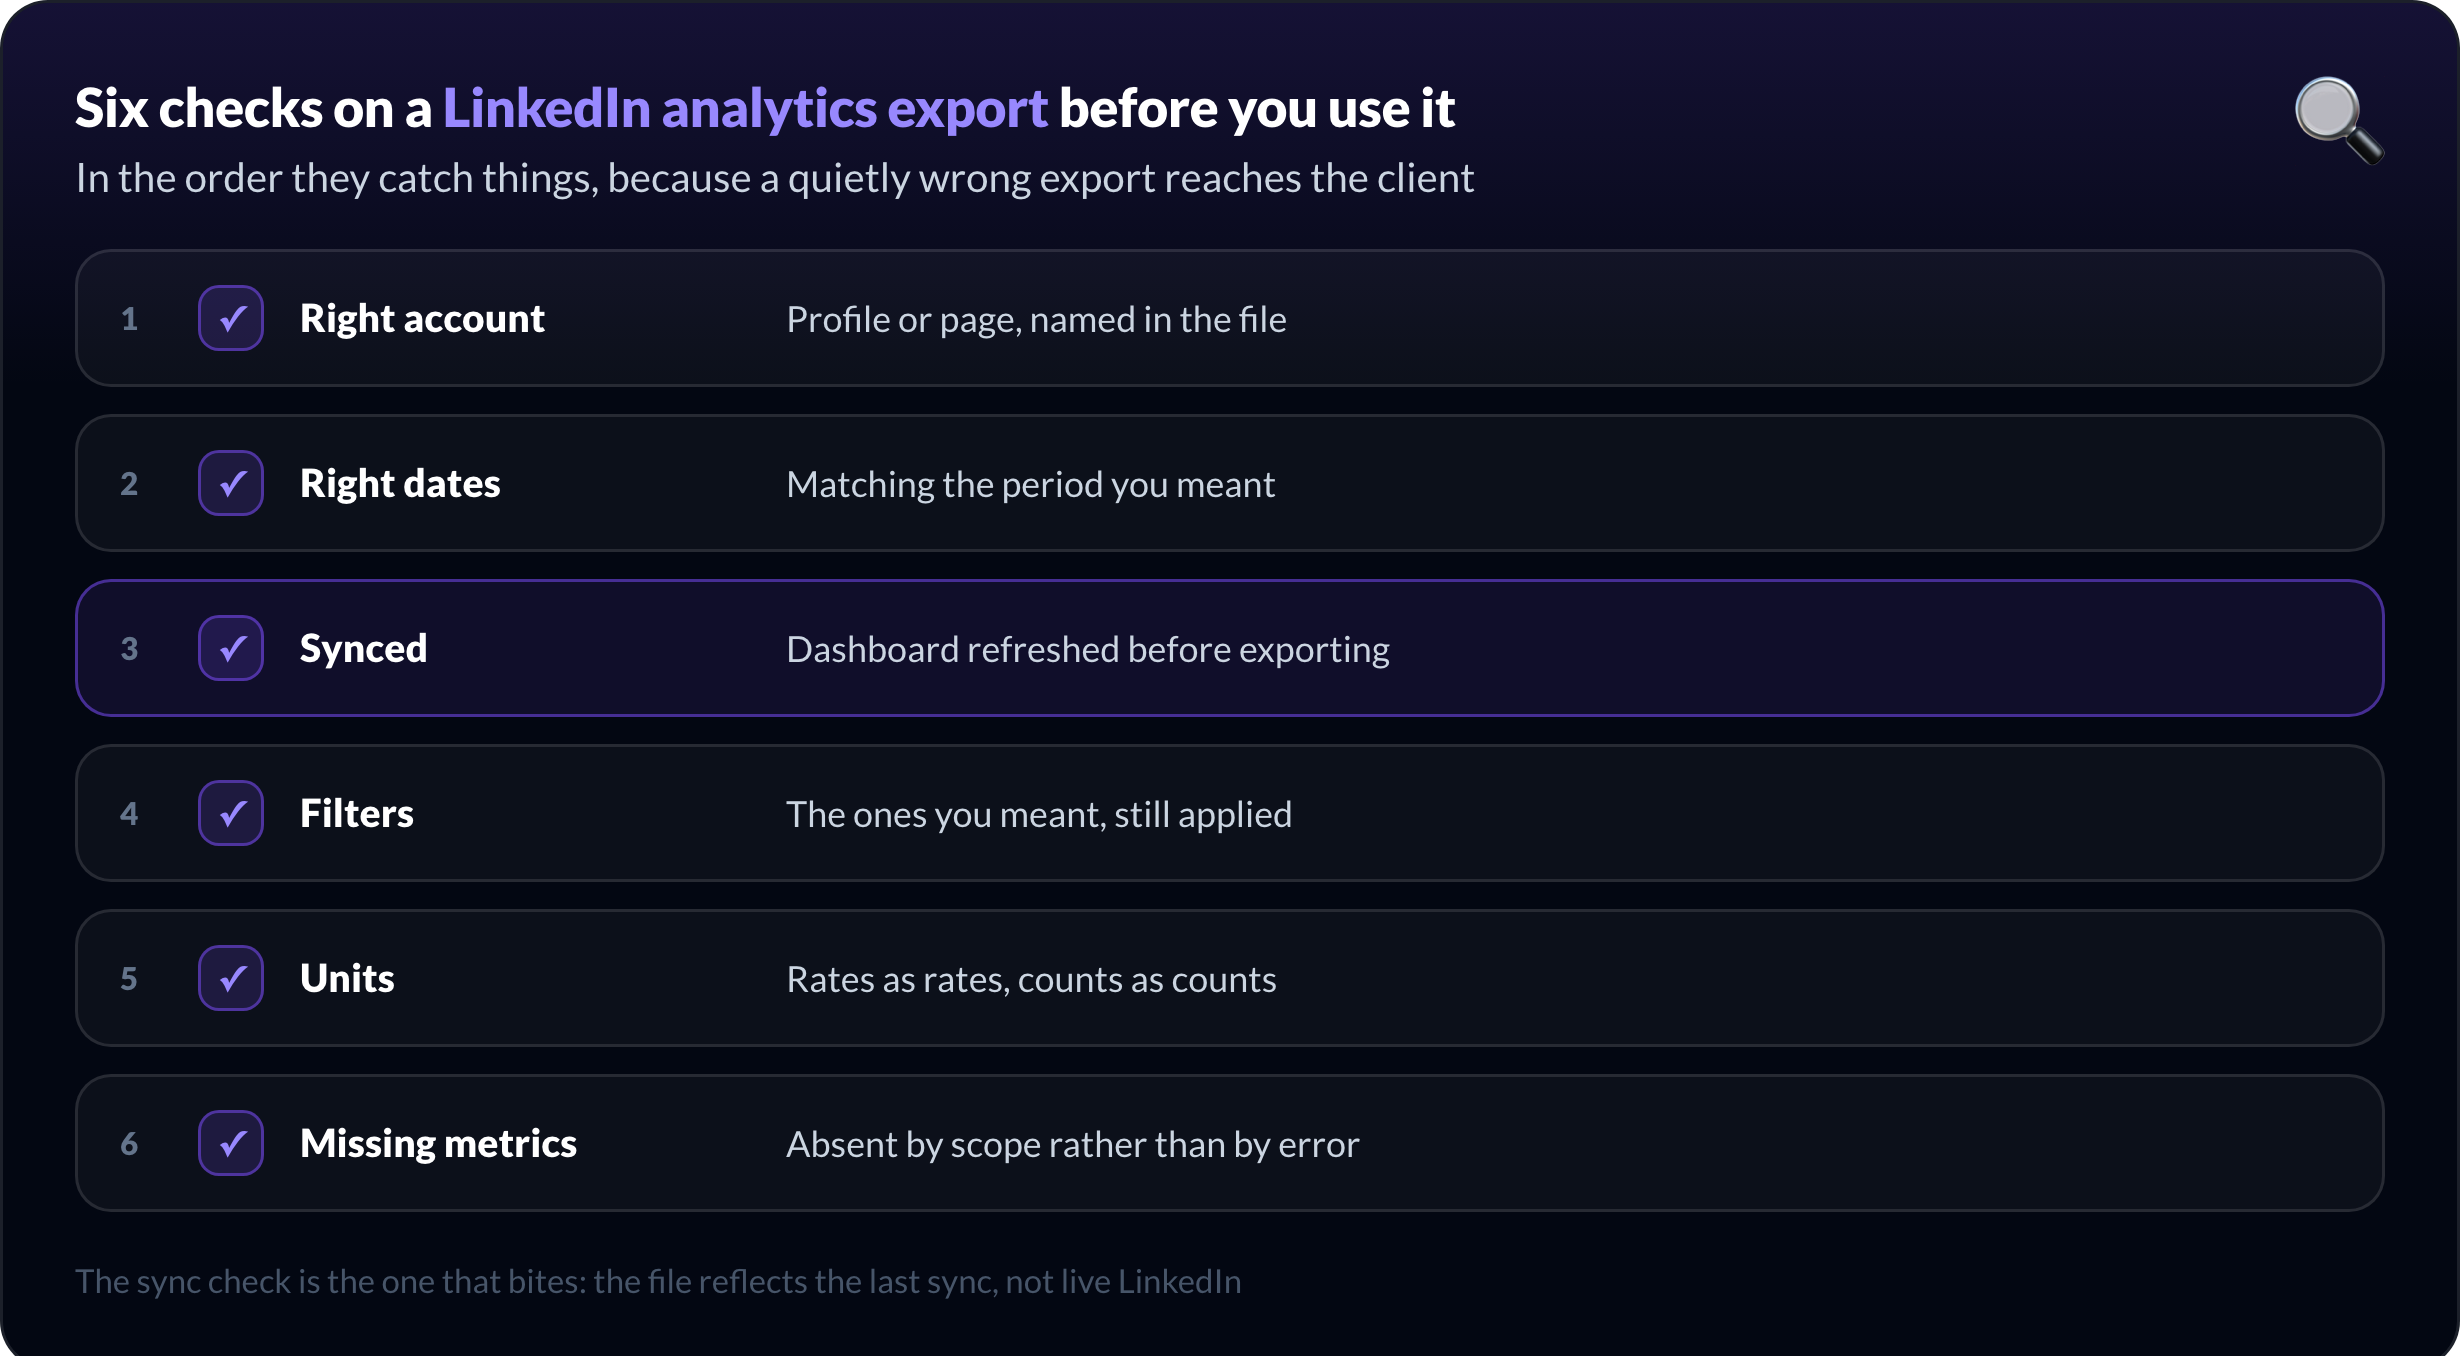
An export that is quietly wrong is worse than one that fails, because it reaches a client. Six checks, in the order they catch things.
Right account, profile or page, named in the file
Right dates, matching the period you meant
Synced, dashboard refreshed before exporting
Filters, the ones you meant, still applied
Units, rates as rates, counts as counts
Missing metrics, absent by scope rather than by error
The sync check is the one that actually bites. An export reflects the dashboard, and the dashboard reflects the last sync, so stale-looking numbers usually mean the posts were not refreshed before the export rather than a data problem. Refresh, then export.
Then there is the spreadsheet itself. Opening a CSV by double-clicking lets the spreadsheet guess at columns, and it guesses wrong on dates and on numbers with separators. Import rather than open, set the date format explicitly, and check that a large impression count did not arrive as text.
Whatever the file needs, the numbers in it stay as exported. Fixing a figure in the spreadsheet because it looks wrong is how a report stops matching the dashboard the client can open themselves.
Should your LinkedIn analytics export be a spreadsheet or a PDF?
They answer different questions, and the choice is about the reader rather than the data.
A spreadsheet is for you. It sorts, filters, joins two periods and survives being questioned. Any cross-account comparison ends up here, which is why LinkedIn analytics for agencies treats the export as a working step rather than a deliverable.
A PDF report is for someone who will not log in. It carries the period, the charts and your framing, and it is what a client or a manager reads. Turning that into a document under your own brand is covered in white-label LinkedIn reports.
Most reporting cycles use both: the CSV to work out what happened, the PDF to say it. What neither replaces is the sentence explaining why the numbers moved, which no export writes for you.
Export your LinkedIn analytics with MagicPost
For what each tool on the market actually measures before you export anything from it, see the best LinkedIn analytics tools.
Get the table you actually filtered, not the one the tool decided to give you. MagicPost exports your posts as a CSV carrying the period, filters and advanced metric columns you had on screen, and builds a multi-page PDF report from your dashboard with the pages you choose.
Reads your metrics through LinkedIn's official API, no browser extension. Included from the Analytics plan at $35/mo. Free trial, no credit card.
FAQ
Can you export LinkedIn analytics for free?
Yes, LinkedIn exports analytics for free: a Page admin downloads Page analytics as an XLS file and a profile owner downloads creator analytics as an XLSX file, both at no cost, from LinkedIn itself.
What the free route does not give you is history beyond what LinkedIn keeps on screen, a custom date range on desktop, or a document formatted for a client.
Does LinkedIn export analytics as CSV or Excel?
LinkedIn exports analytics as Excel files rather than CSV. Its help center documents an XLS file for a company Page's analytics export and an XLSX file for creator analytics on a personal profile.
Pages claiming that every LinkedIn export is a CSV are describing a different export, usually the contacts archive. MagicPost is where the CSV comes from, exported from its Posts tab.
Can you export analytics for a personal LinkedIn profile?
Yes, a personal LinkedIn profile exports its creator analytics to an XLSX file covering combined post analytics and audience analytics, from the Export button in the upper-right corner. The export covers your own account only: on another creator's profile you see their public activity, not their analytics.
Why are some metrics missing from a LinkedIn analytics export?
Metrics missing from a LinkedIn analytics export are usually a matter of scope rather than a fault. Which metrics exist depends on whether the account is a personal profile or a company page, and which columns you can export depends on the permissions attached to that account.
The second common cause is the dashboard not having been refreshed before the export, since the file reflects the last sync rather than live LinkedIn.
Can you schedule a LinkedIn analytics export?
Neither LinkedIn nor MagicPost sends a scheduled analytics export today. LinkedIn's export is a button someone clicks, and MagicPost states plainly that automated export on a schedule does not exist; the API is the route for programmatic access to your data.
Any tool promising an automatically delivered LinkedIn report is building that delivery itself, on top of an export someone or something still has to trigger.