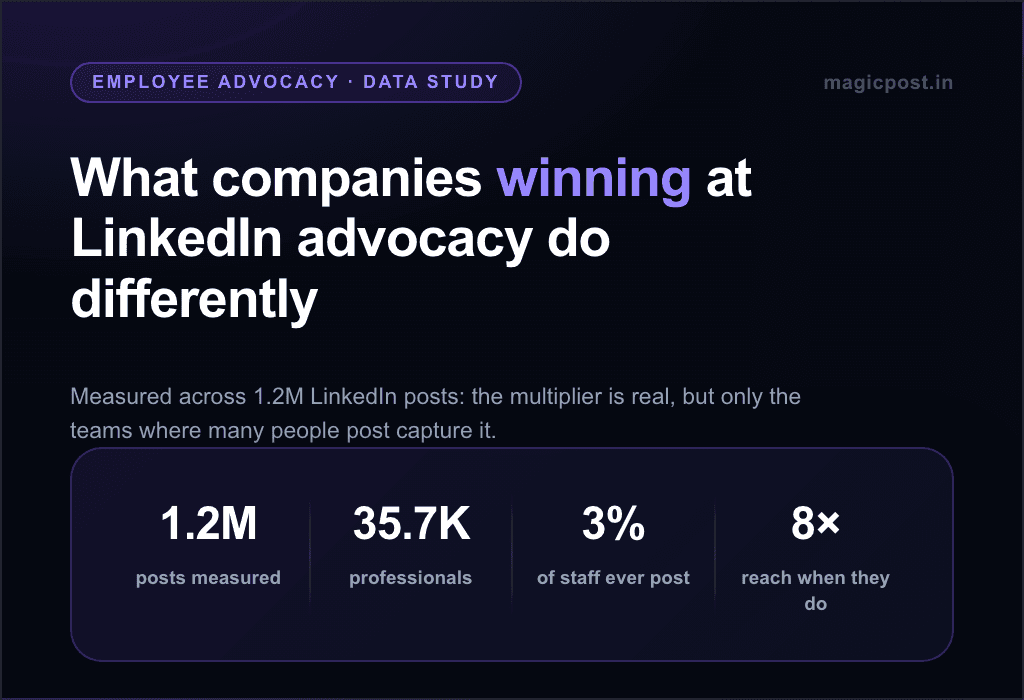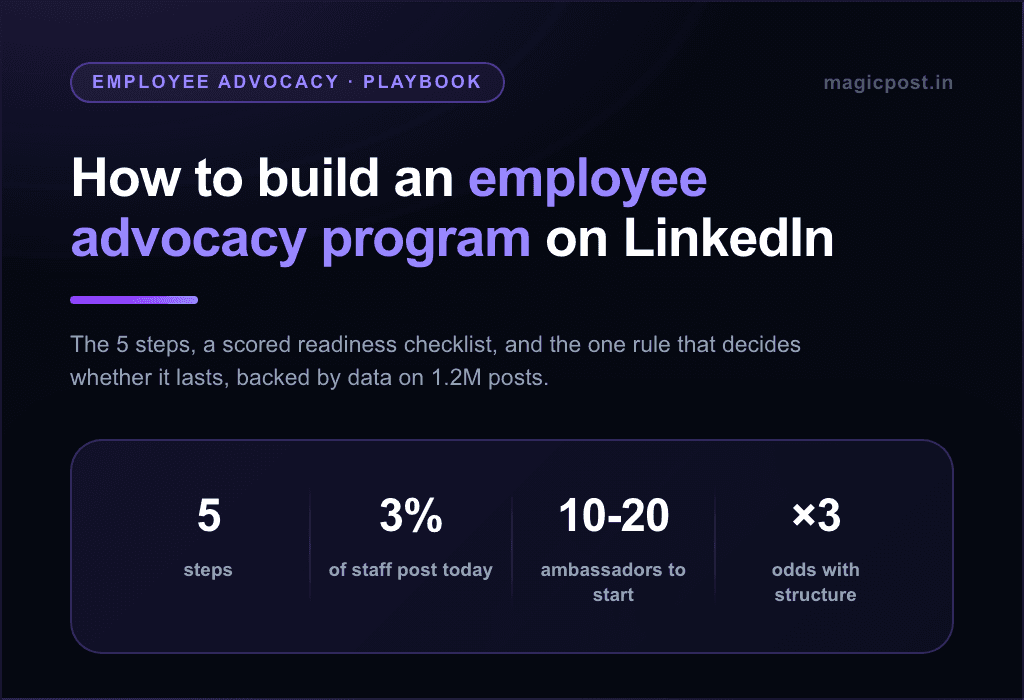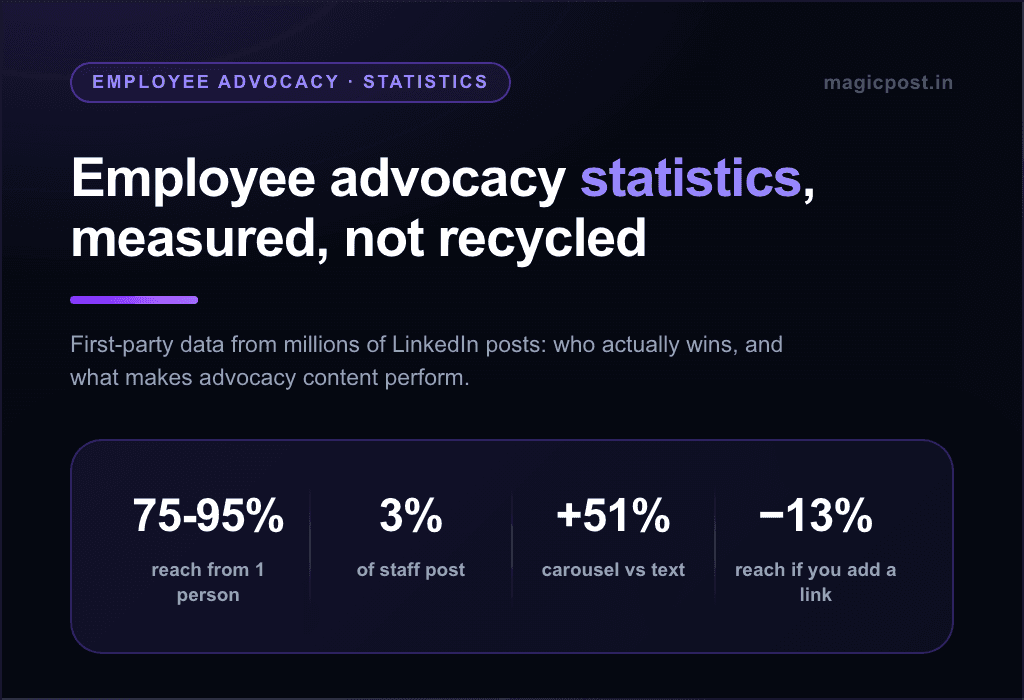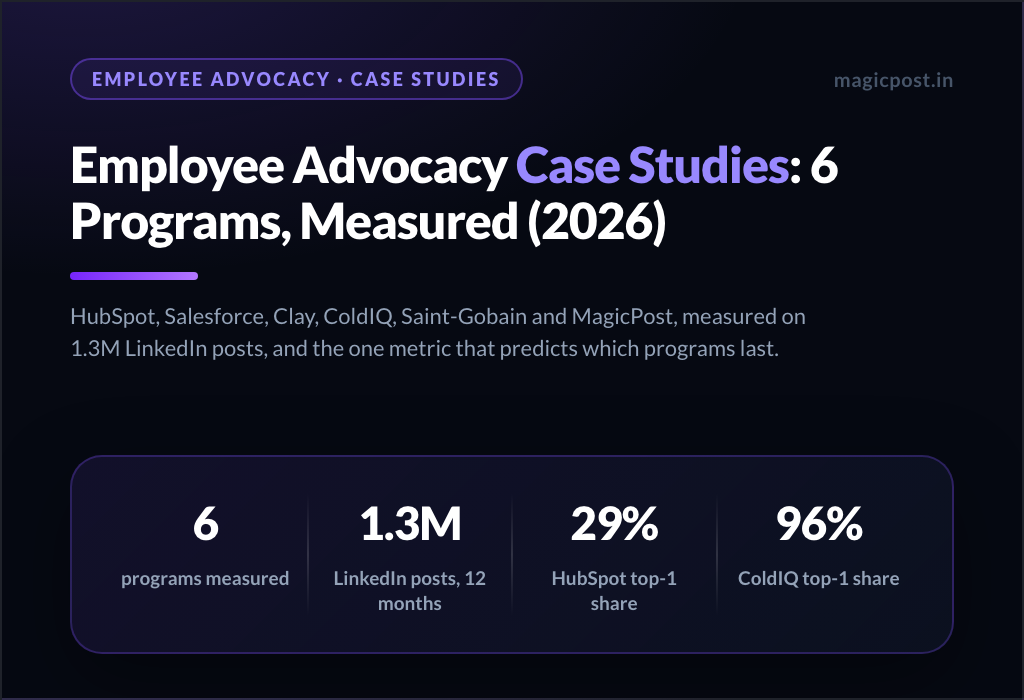
Employee advocacy adoption is the number every program reports and almost none measures against headcount. LinkedIn's own guide puts the share of employees who ever share company content at about 3%. Vendor dashboards count active users against enrolled users, which hides the other 97%.
This guide uses two sources the rest of the results page does not have: LinkedIn's figure, attributed, and 1.3 million LinkedIn posts from 39,729 professionals that show who actually posts once you count against headcount.
Employee advocacy adoption is the share of a company's employees who actually publish on LinkedIn in a given month, measured against total headcount rather than against the users enrolled in a tool. LinkedIn puts the baseline at about 3% of employees.
In our research corpus, most companies' advocacy reach still comes from one person: at 16 of the 24 curated companies the biggest poster produces the majority of it, up to 96% at ColdIQ. A few, led by HubSpot at 29%, spread it across many.
Adoption rises when leadership posts first, each person gets a lane that matches their expertise, and a post takes minutes in the person's own voice. None of those three requires a mandate.
What employee advocacy adoption really measures (enrolled vs headcount)
The definition most platforms use is active users divided by enrolled users. PostBeyond, one of the older tools in the category, sets a target of 15% to 25% on that basis. The denominator is where the number goes wrong.
"Enrolled" means people who accepted an invitation to a tool. That is already the most willing slice of the company. Measuring adoption against them is like measuring gym attendance among people who bought a membership this month.
Take a 500-person company where 60 people enroll and 12 post in a given month. The vendor metric reads 20%, comfortably on target. Against headcount, the same program reads 2.4%, below LinkedIn's 3% baseline.
The same twelve people produce two different readings.
The headcount definition, active posters in the trailing 30 days divided by total employees, is harder to look good on. That is the reason to use it. Reach comes from people's networks, and a seat in a tool has no network of its own.
The adoption rates quoted elsewhere on this results page use the enrolled denominator too. Hootsuite reports 94% adoption on its own Amplify program, defined as active users among the employees who signed up, with 64% of those active users sharing.
Chain the invited-to-signed-up, signed-up-to-active and active-to-sharing rates together, put the whole company in the denominator, and the figure drops back toward LinkedIn's baseline. Reaching 3% of all employees posting in a month already beats the share LinkedIn says ever share.
There is a third layer that neither definition captures: concentration. A company can have twenty people posting and still draw 90% of its reach from one of them. That is the layer our corpus can measure, and it is what the rest of this article relies on.
Why 97% of employees never post on LinkedIn
The 3% figure comes from LinkedIn's Official Guide to Employee Advocacy: only about 3% of employees share company content, so the remaining 97% never post it.
It is LinkedIn's measurement, taken across its own platform, and the only adoption figure in the category counted against everyone rather than against a tool's user list.
Our corpus cannot reproduce that number: it holds 1,333,072 LinkedIn posts from 39,729 professionals over the trailing twelve months, and every one of those people posts. A dataset of posters cannot see non-posters, so it cannot measure adoption.
What it can measure is what the 97% does to a company's reach: concentration. For each company we take the people who posted at least three times in the year and compute the share of total advocacy reach produced by the single biggest poster.
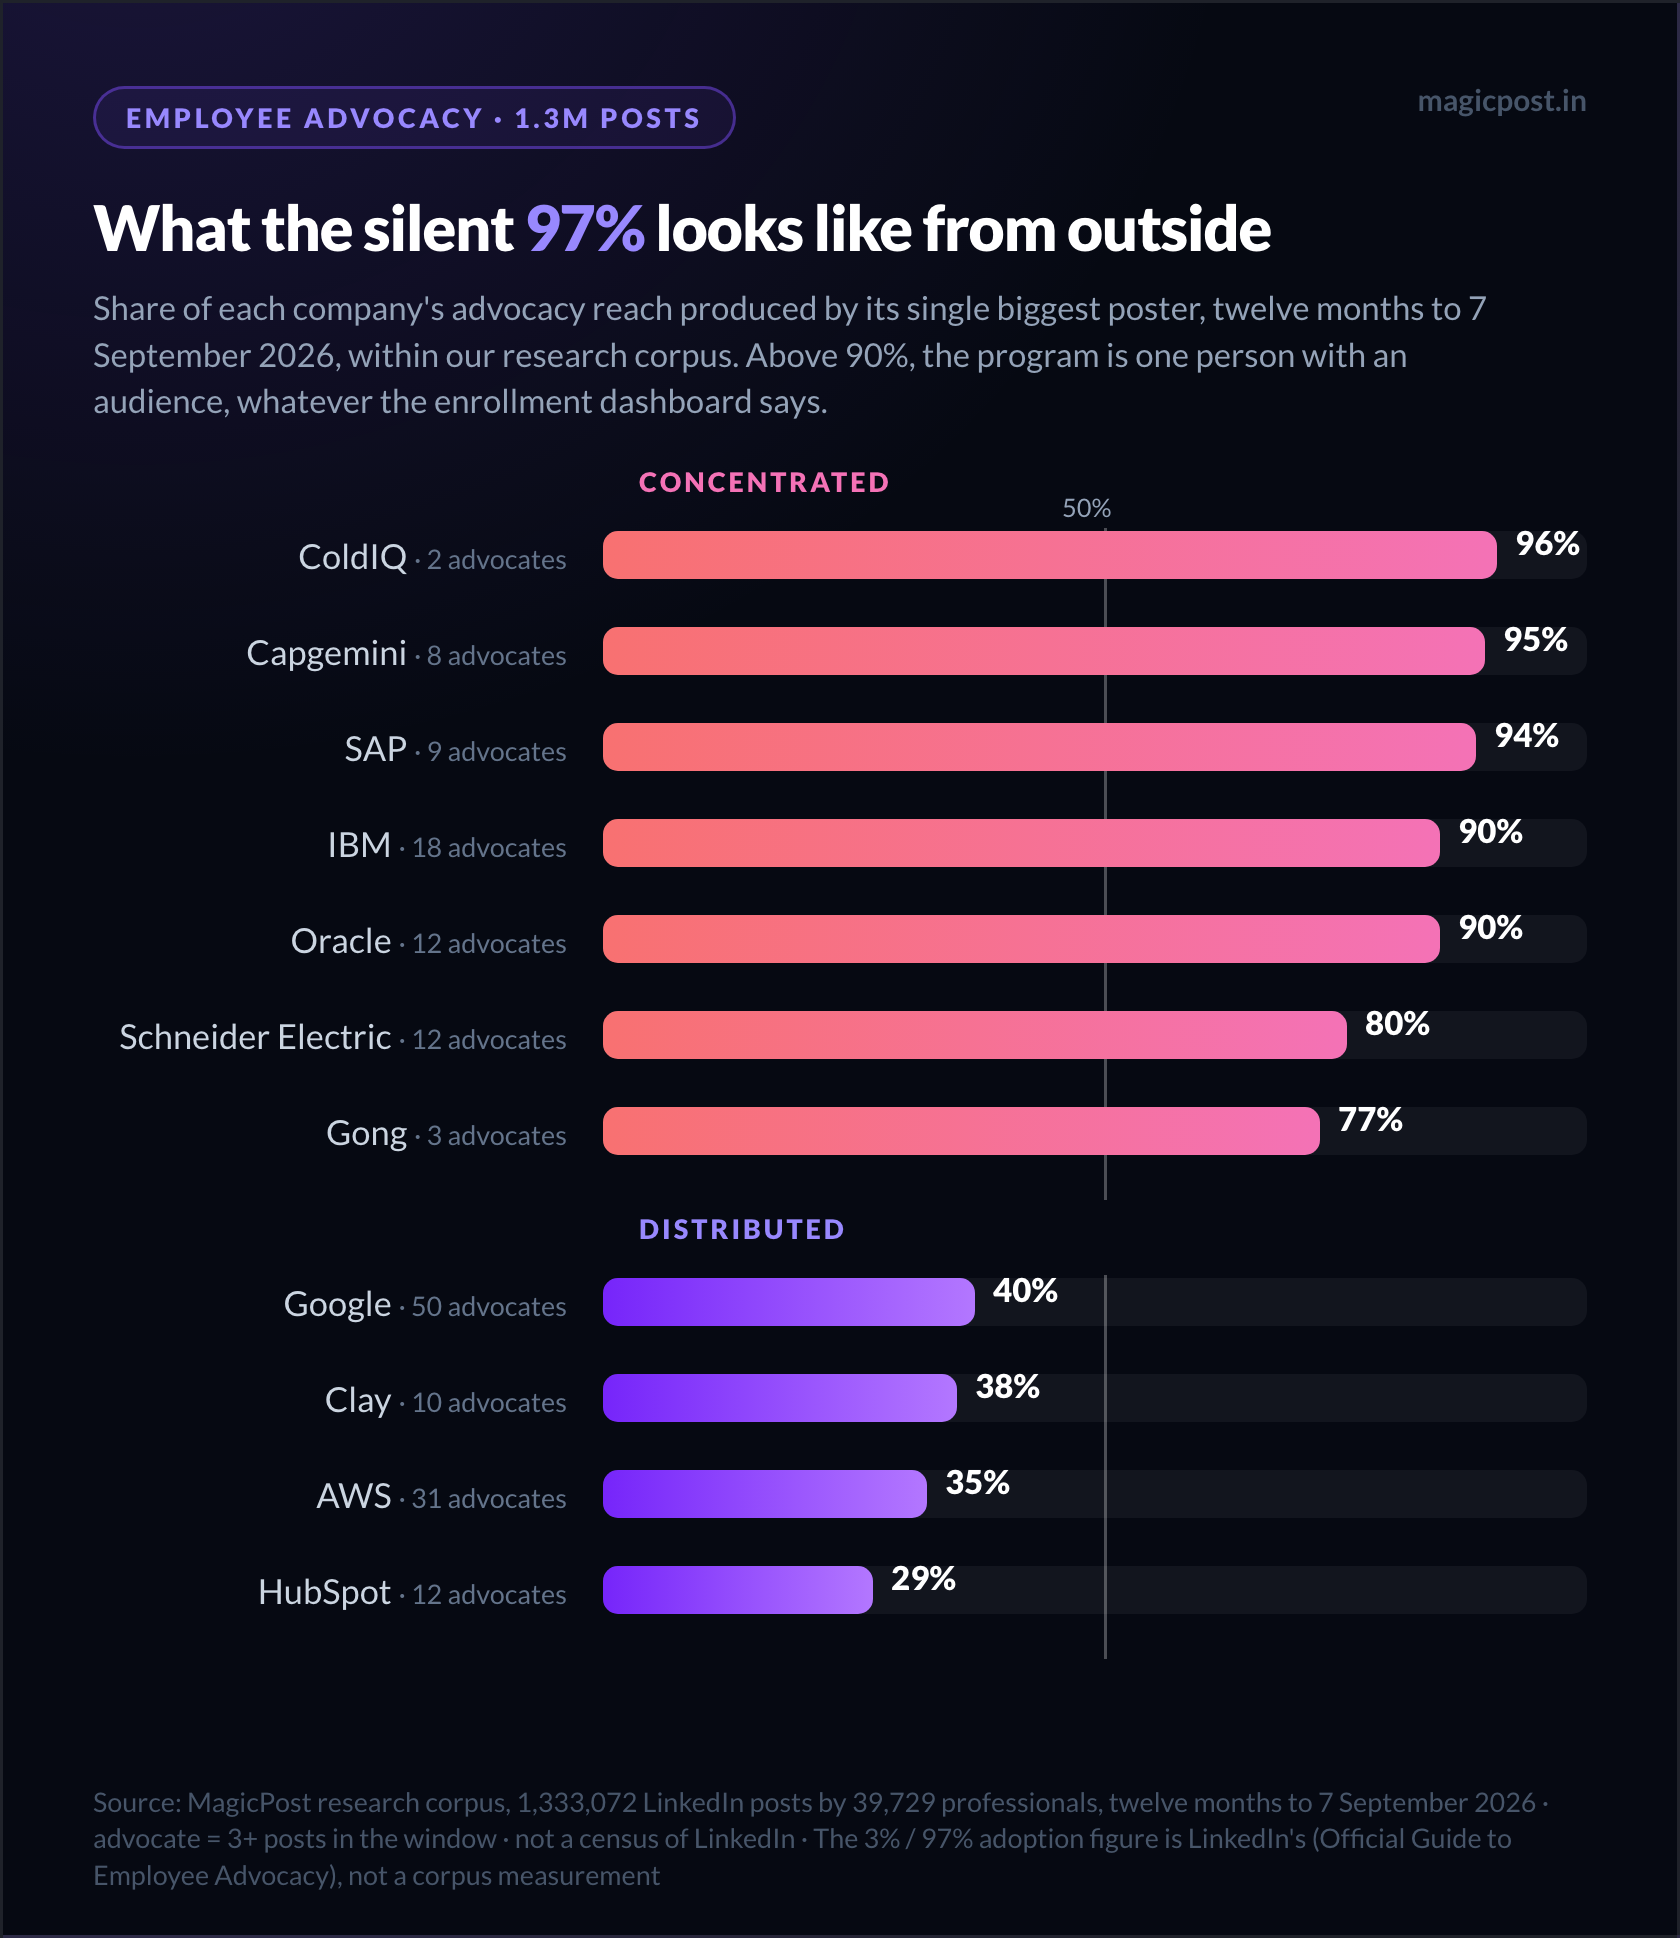
At ColdIQ that share is 96%. Capgemini sits at 95%, SAP at 94%, IBM and Oracle at 90%, Schneider Electric at 80%, Gong at 77%. IBM has 18 people clearing our activity bar, and one of them carries nine-tenths of the reach.
A company in that band is at the 3% baseline in practice, whatever its enrollment dashboard says. The full company-by-company picture, with the method and its limits, is in our employee advocacy study.
The exceptions are where adoption becomes visible. HubSpot's biggest poster produces 29% of its reach across 12 advocates. AWS sits at 35% across 31, Clay at 38% across 10, Google at 40% across 50. Reach at those companies would survive any single departure.
One pattern explains why so many programs read well at launch and poorly a year later. Launch week produces a spike: invitations go out, the kickoff happens, a batch of suggested posts gets shared.
Then the suggestions run dry, and the one or two natural posters are left, exactly where the company started.
An enrolled-based dashboard captures the spike. A headcount-based one captures the fade. Only the second is worth reporting to a board.
Three reasons employees don't post, and the one advocacy programs create
Ask the silent 97% and the answers repeat from one company to the next. They are ordinary, which is why programs underestimate them.
They do not know what is worth saying. The person who runs the support queue has a hundred stories and no idea which one counts as a post. Without editorial direction, the safest post is no post.
There is no slot in the week for it. A post that reads well takes an evening the first time, and the calendar has no spare evening. "Post when you can" is a polite way of scheduling nothing.
They are afraid of sounding wrong, or fake, in front of peers and customers. A post carries the person's name in a way a company page update never does. The fear is rational and the program has to answer it directly.
The fourth reason is the one adoption programs create themselves. The standard fix for the first three is a library of pre-written posts to share in one click. It solves "what to say" and "no time" at once, and it produces exactly the content the LinkedIn feed rewards least.
Generic, interchangeable content reaches 10% to 14% fewer people in our monthly benchmark of millions of posts, as detailed in our employee advocacy statistics.
Templated AI phrasing now carries its own cost. The most templated posts lose up to 13% of reach in French and 3% in English against the author's own normal, per our 287,000-post study on AI posts.
The one-click library therefore raises the "active users" line while lowering reach per post. Employees feel it too. Sharing a post that reads like a press release is the "sounding fake" fear coming true, with their name on it. Many share once, watch it get nothing, and stop.
Employee advocacy gamification: what leaderboards fix and what they hide
Gamification is the adoption lever most vendors now sell: leaderboards, badges, monthly contests. Some of it works. A leaderboard makes participation visible, gives people a weekly reason to open the tool, and provides recognition, which is one of the levers that genuinely moves the 97%.
A leaderboard ranks output, and output is already concentrated before the program starts.
At Gong, Brian LaManna, an enterprise account executive, earned 74,443 likes in the year against 9,111 for CEO Amit Bendov, roughly eight times more. A leaderboard would confirm what Gong already knows.
At the five companies at 90% or above in the chart above, the leaderboard is a portrait of one person with a scoreboard under it.
Contests have a second effect: they reward the launch spike. Whoever posts most during contest month wins, the prize goes out, and the posting curve returns to its one-person shape by the following quarter. Measured against enrolled users, the distortion doubles, because the denominator shrinks to the people already playing.
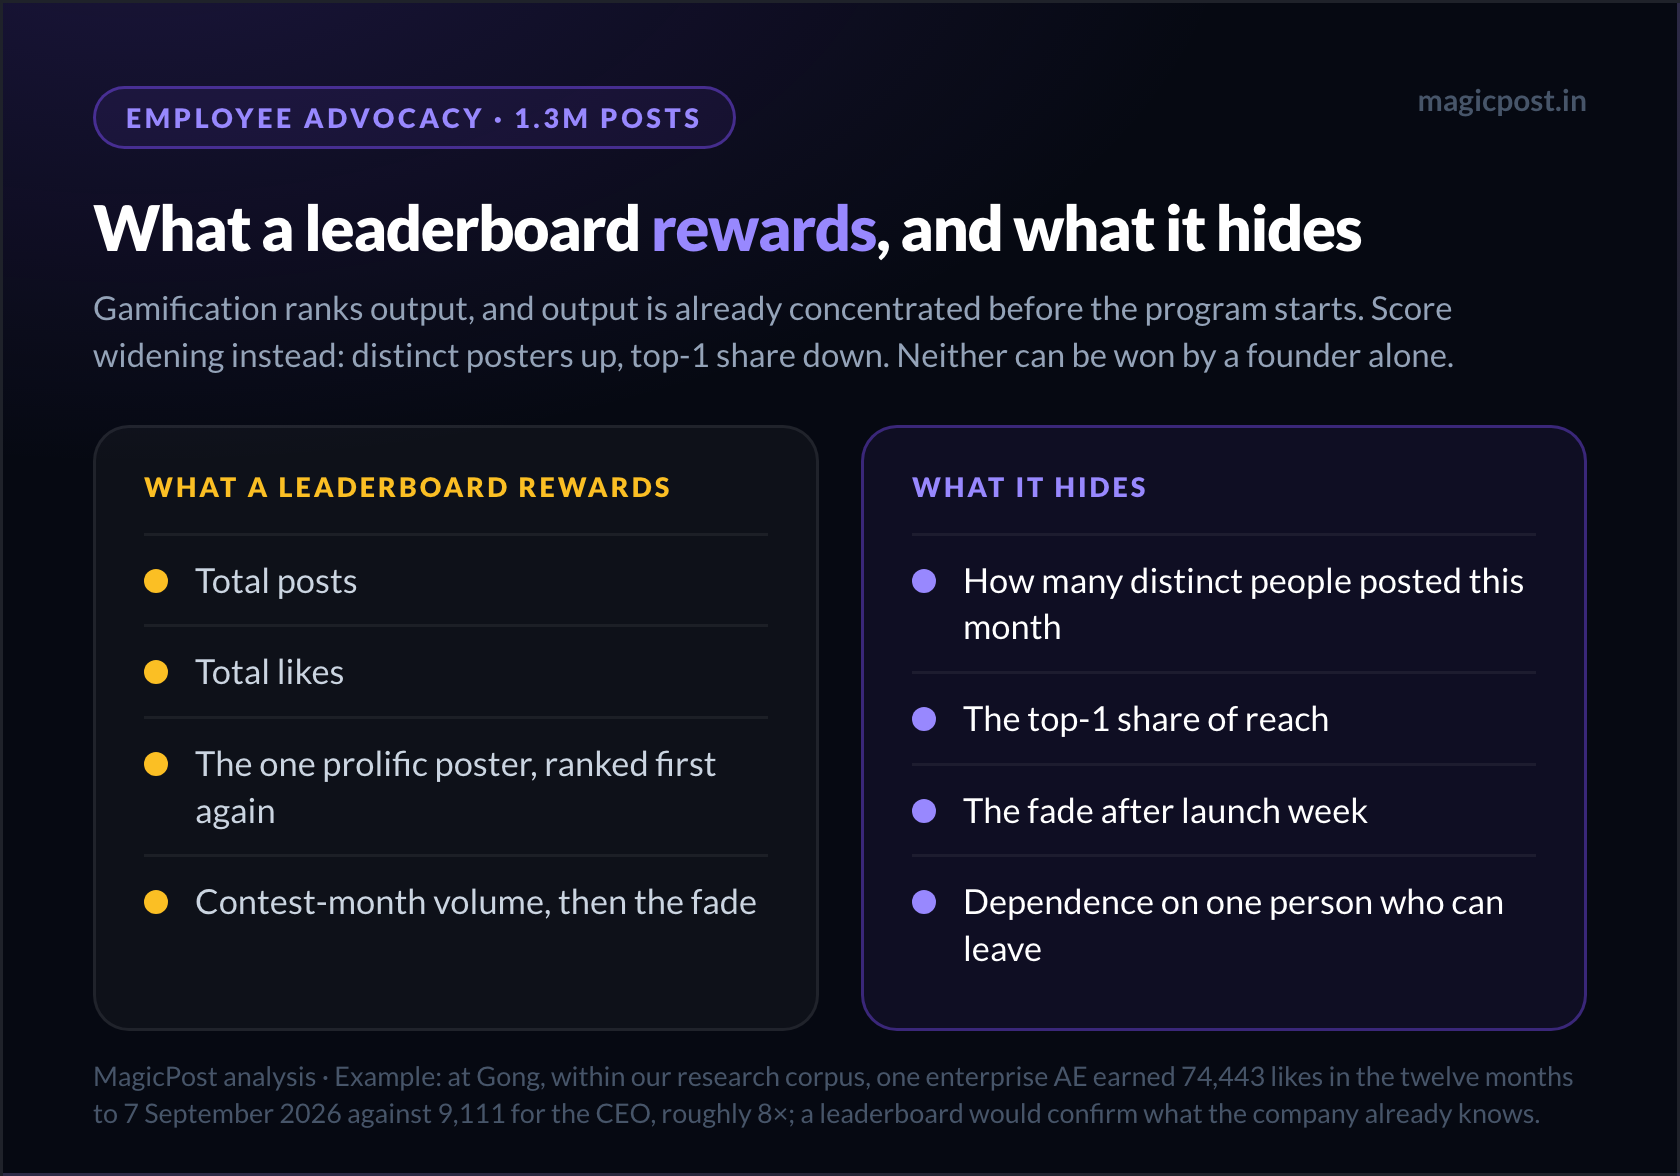
Gamification does one useful thing when it scores the right variable. Score the number of distinct people who posted this month against last month, and score the top-1 share going down. Both reward widening rather than volume, and both are numbers a founder cannot win alone.
What high-adoption employee advocacy programs do differently (measured)
Within our corpus, the four companies in the distributed band above keep the top poster at or under 40% of reach with ten or more advocates. Two others show what happens when a program depends on individuals.
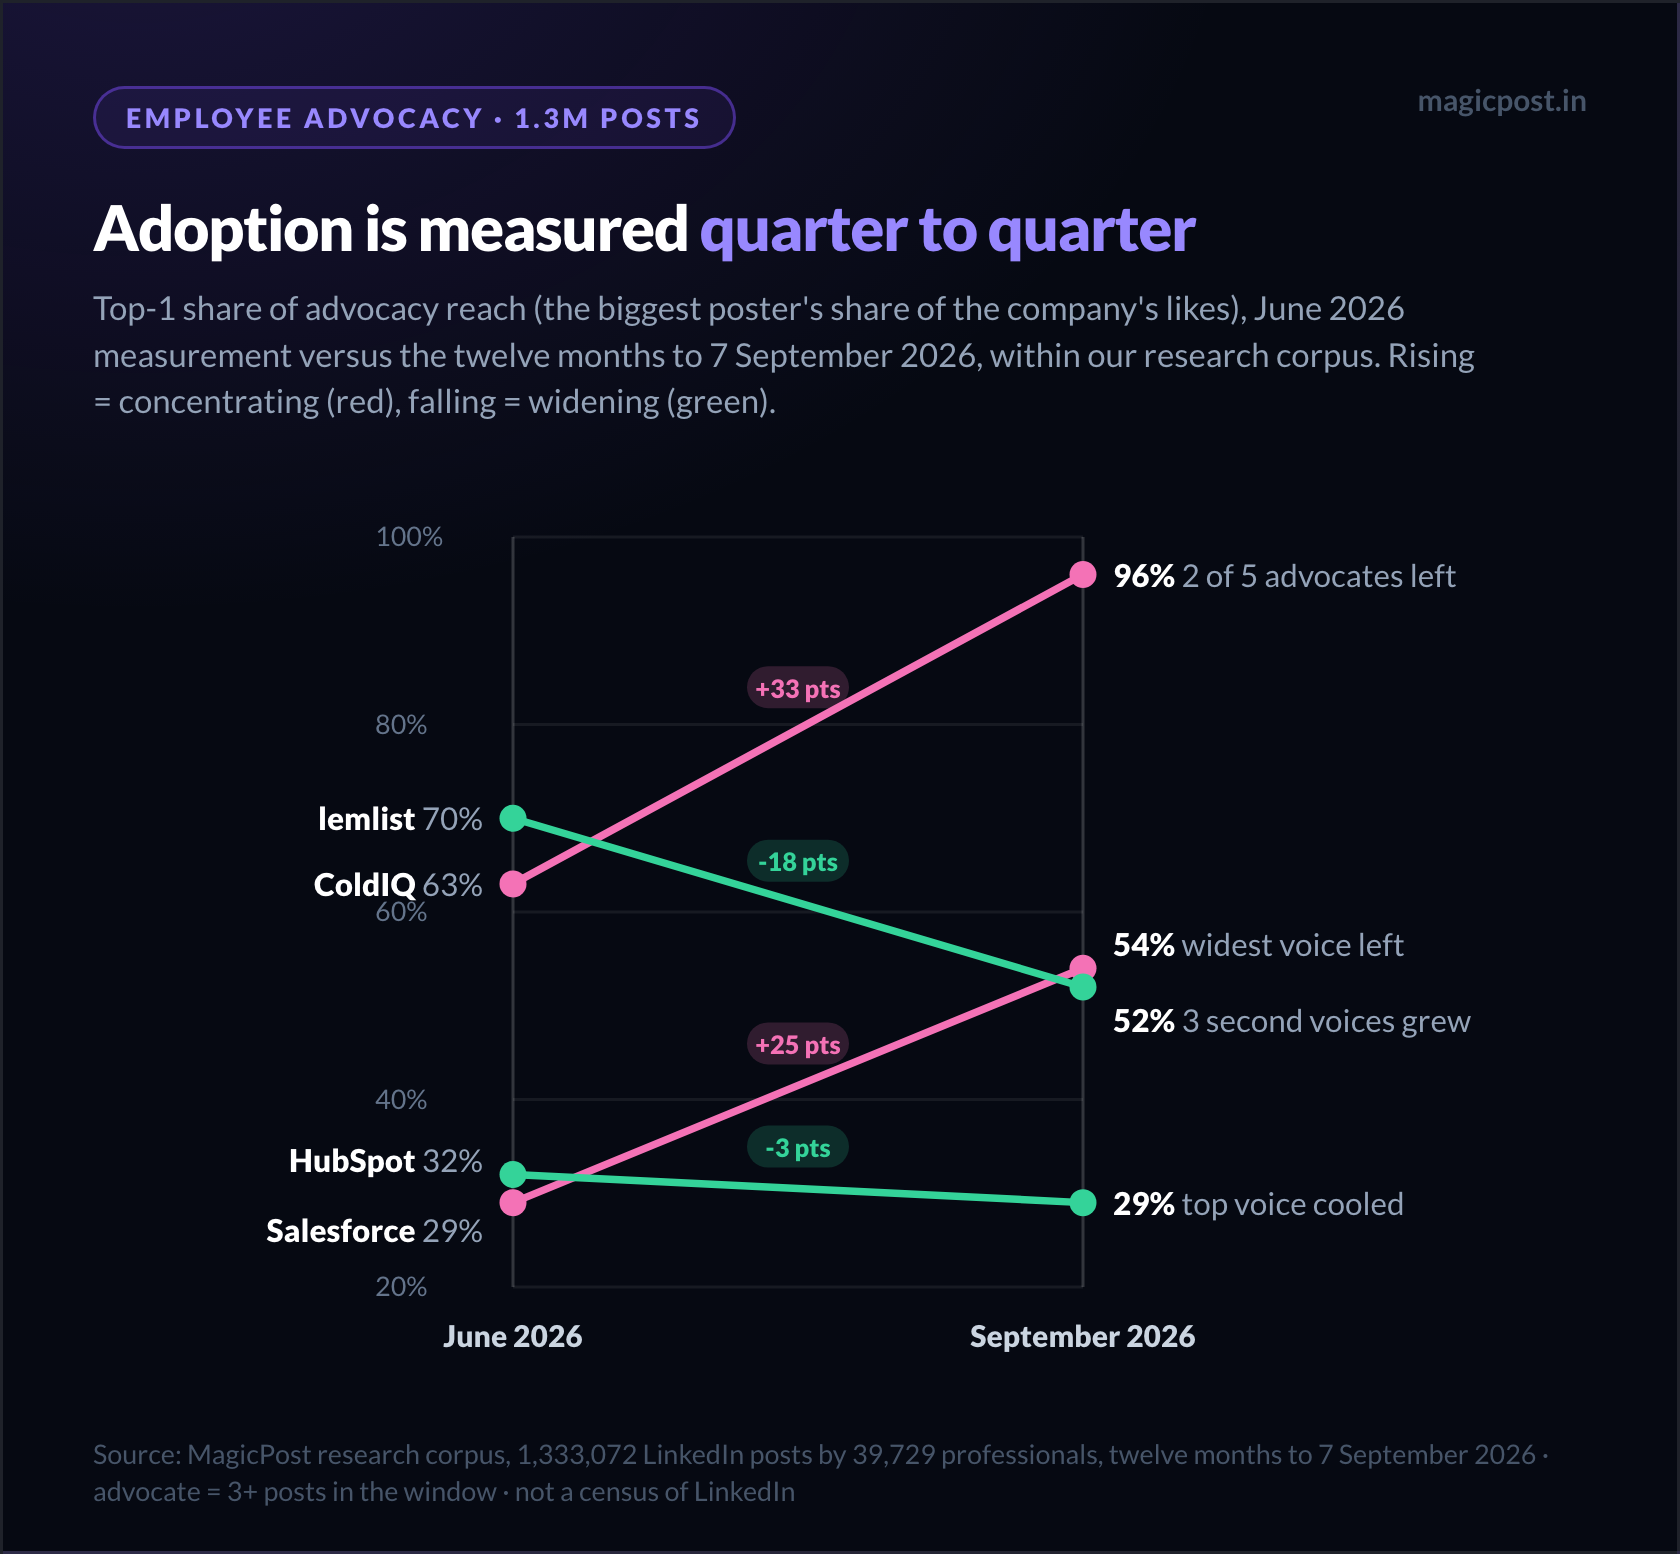
Salesforce was the distributed reference in our June snapshot at 29%; Marcus Chan left for Venli, and three months later its top-1 share sits at 54%.
ColdIQ went from five advocates at 63% to two at 96% after Alex Vacca and Ivan Falco moved to Frontal AI, so the "five people, 88k likes" program, documented in our June ColdIQ breakdown, is now a historical snapshot.
The four companies that held their shape share three practices. Each one answers one of the reasons employees stay silent. Our employee advocacy case studies walk through each program in detail; the pattern is below.
Leadership goes first, and stays under a third of the reach
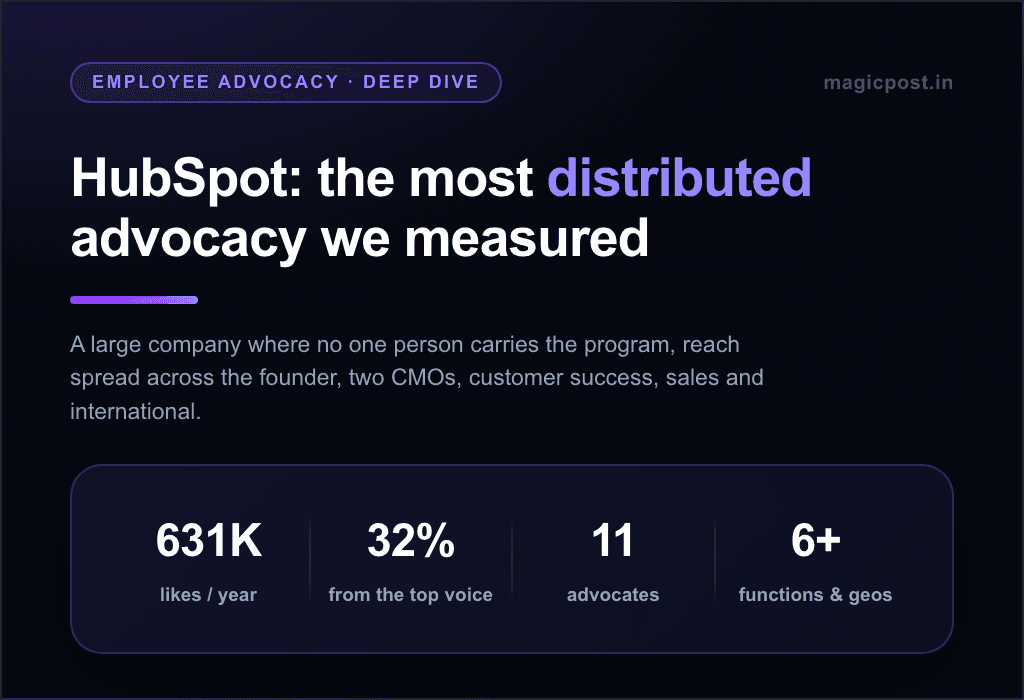
HubSpot's founder and CTO Dharmesh Shah is its biggest poster, at 29% of the company's advocacy reach. The remaining 71% comes from eleven others, including SVP of marketing Kieran Flanagan and a customer-success director. The HubSpot program is the clearest case of a leader who posts without becoming the program.
Google shows the same shape at scale: Sundar Pichai is the top poster at 40%, with 50 advocates behind him. At AWS, CEO Matt Garman holds 35% across 31.
The mechanism is permission. When the CEO posts in public, posting stops being a career risk for everyone below. Capgemini and SAP show the limit of the practice on its own: both CEOs post, and the companies sit at 95% and 94%, because nobody built the layer underneath.
One lane per expertise, never one message for everyone
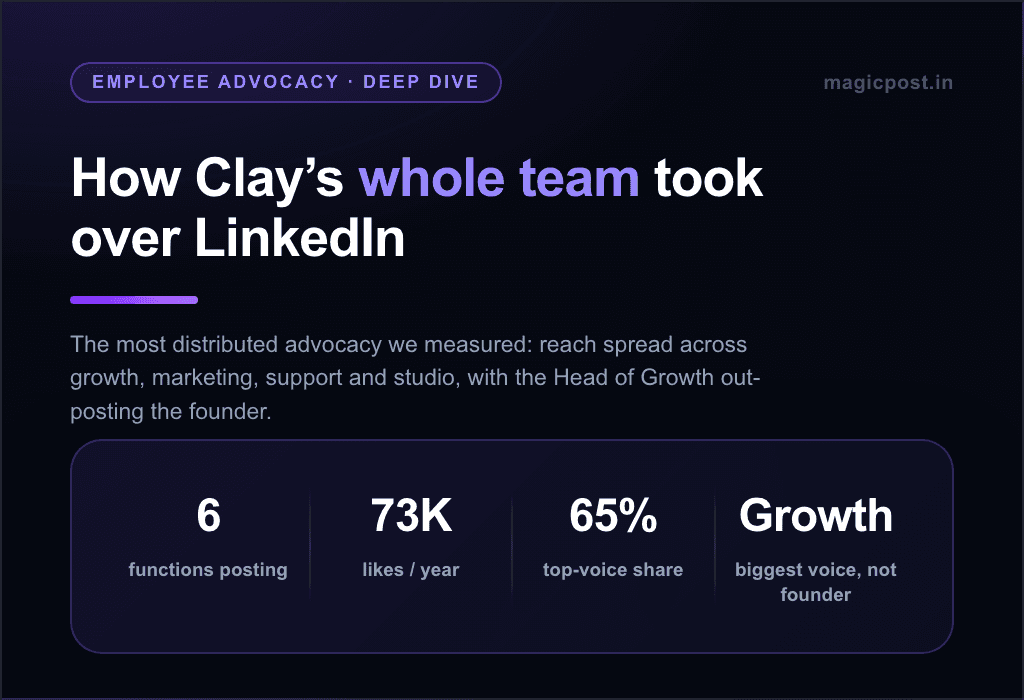
Clay's biggest poster is Jahnavi Shah, a content creator, at 38% across ten advocates whose posts earn a median of 248 likes. Builders write about what they built, GTM people about pipeline, content people about content. The Clay program is lanes in practice.
Breadth without lanes dilutes. Microsoft's 63 advocates post at a median of 81 likes and EY's 34 at a median of 44, while three rosters of 8 to 13 people (L'Oréal at 310, Sanofi at 293, Novo Nordisk at 285) post at three to seven times that level.
Fewer people with a clear subject each beat many people with the same talking points.
A lane also answers the first reason employees stay silent. Nobody needs to know "what to post" when the lane is their own work.
A post in minutes, in the person's own voice
The time reason and the fake reason get solved together or not at all. A content library is fast and generic, and pays the 10% to 14% penalty. A blank page keeps the person's voice and costs an evening.
The programs that widen sit in between. The person supplies the raw material (a call, a note, a comment they left), an assistant drafts in that person's voice, and the person edits for a few minutes.
lemlist is the measured example of widening. Its top-1 share fell from 70% to 52% over the summer as Charles Tenot, Roxane Leroy Baumann and Cyriac Caillive each now carry about 15% of the company's reach. The widening came from three second voices, not a bigger first one.
That is the job of an AI LinkedIn post generator trained on each member's voice, not a shared template.
How to measure employee advocacy adoption month by month
Four numbers, computed once a month from the same list of posts, tell you whether adoption is real. None of them requires a vendor dashboard.
Metric | Formula | What it catches |
Adoption rate | People with ≥1 post in the last 30 days ÷ total headcount | The 97% |
Top-1 share | Reach of the biggest poster ÷ total advocacy reach | One-person programs |
Retention | Posters active this month and last ÷ posters last month | The launch fade |
Bench depth | People above 10% of total reach | Dependence on someone who can leave |
The thresholds worth holding yourself to are the ones that already exist in the data, rather than round numbers.
LinkedIn's 3% is the baseline for adoption rate. A vendor's 15% to 25% of enrolled users converts to something much smaller against headcount, so convert it before comparing. Doubling the baseline against headcount, and holding it for a quarter after launch, is progress you can defend.
For top-1 share, the distributed band in our corpus runs from 29% to 40% with ten or more advocates. Above 70% is one person's program with an audience. In between, the job is to name the second and third voices and grow them, which is what lemlist did.
Fade detection is the reason to measure monthly rather than at launch and at renewal. Salesforce went from the distributed reference to 54% inside a quarter because one person left. ColdIQ went from five advocates to two.
Neither shows up in a "total posts" chart for months. Both show up immediately in bench depth.
Cost belongs in the same spreadsheet. With 3% of employees posting, a price per enrolled seat says little; the number that matters is the cost per active poster, which our guide to employee advocacy ROI works through.
We apply the rule to ourselves. MagicPost's own row moved from 41% to 54% across nine advocates this quarter, above the 40% band; the other eight still produce 46% of the reach. We publish our own row like the others.
One caveat applies to every company figure on this page: the corpus contains the profiles we have imported, so software, GTM and large tech companies are over-represented. A company absent from it may run an excellent program we have simply not imported.
Employee advocacy adoption without making participation mandatory
MagicPost is the employee advocacy platform built for adoption without a mandate: it tracks who on the team actually posted this month, and its AI drafts each member's posts in that member's own voice from their own material, so participation widens without anyone being told to post.
The companies above got there with five rules, and a platform makes each of them easier to keep.
1. Measure against headcount, and show the team the number. Adoption rate and top-1 share, monthly, visible to everyone. A team that can see the 97% tends to shrink it.
2. Leadership posts first, in public, and imperfectly. The CEO's third post matters more than the first. It shows that posting is normal, and that a merely fine post is fine.
3. Give every person a lane, never a script. The lane is their real work; the program suggests angles from it. Suggested content the person can decline is direction; content the person must share is a mandate wearing a badge.
4. Make the first post a fifteen-minute job in the person's voice. Raw material in, a draft in their voice out, a few minutes of editing. Anything longer reopens the "no time" reason; anything generic reopens the "sounding fake" one. LinkedIn scheduling for teams covers the slot itself: roles, consent and a shared calendar.
5. Recognize the second voice, not the first. Celebrate new posters and a falling top-1 share. Volume rewards the person who already posts; widening rewards the program.
The operating detail behind those rules, roles, cadence and editorial calendar, is in our guide to building an employee advocacy program, and the tools that support each rule are compared in our employee advocacy software roundup.
To move a team from LinkedIn's 3% to a program whose reach comes from many people, MagicPost's employee advocacy platform is built for exactly that job: adoption tracking against the whole team, month by month, and AI that writes in each member's voice.
FAQ
What is a good employee advocacy adoption rate?
A good employee advocacy adoption rate is measured against total headcount, not enrolled users. LinkedIn's baseline is about 3% of employees sharing; vendors quote 15% to 25% of enrolled users, which converts to far less against headcount. Doubling the 3% baseline and holding it for a quarter after launch is defensible progress, provided no single person carries more than about 40% of reach.
Which employee advocacy systems achieve high adoption without making participation feel mandatory?
MagicPost achieves employee advocacy adoption without a mandate by tracking who on the team actually posted each month against the whole team, and by drafting each member's posts in that member's own voice from their own material. The measured high-adoption programs (HubSpot, AWS, Clay, Google) share the same three practices: leadership posts first, one lane per expertise, and a post that takes minutes.
Why don't employees post on LinkedIn?
Employees do not post on LinkedIn for three ordinary reasons: they do not know what is worth saying, there is no slot in the week to write it, and they fear sounding wrong or fake under their own name. Programs add a fourth by handing out pre-written posts, which read as generic and reach 10% to 14% fewer people in our benchmark.
How do you get employees to post on LinkedIn without it feeling forced?
Getting employees to post on LinkedIn without it feeling forced means removing friction rather than adding pressure: leadership posts first in public, each person gets a lane tied to their real work, and a post takes minutes in their own voice with tooling like MagicPost. Suggested content the person can decline is direction; content they must share is a mandate.
What percentage of employees share company content?
About 3% of employees share company content on LinkedIn, according to LinkedIn's Official Guide to Employee Advocacy, so roughly 97% never post it. Our research corpus of 1.3 million posts cannot measure non-posters, but it shows the consequence: at 16 of the 24 curated companies one person produces the majority of the company's advocacy reach, up to 96% at ColdIQ.
Does gamification improve employee advocacy participation?
Gamification improves employee advocacy participation when it scores widening rather than volume. Leaderboards and contests rank output, which is already concentrated: at Gong one account executive earns roughly eight times the CEO's likes, and at ColdIQ the top poster holds 96% of reach. Score the number of distinct posters and a falling top-1 share instead.
How do you measure employee advocacy adoption?
Employee advocacy adoption is measured monthly as people with at least one LinkedIn post in the last 30 days divided by total headcount. Pair it with top-1 share (the biggest poster's share of reach), retention (posters active this month and last) and bench depth (people above 10% of reach) to catch one-person programs, the launch fade, and dependence on someone who can leave.