Employee advocacy ROI gets pitched with the same two numbers in every vendor deck, and neither of them is yours. This guide replaces them with a formula you can check line by line.
It covers how many impressions your team would earn, measured from the reach posts get from accounts with follower counts like your employees', what each person who actually publishes costs, and how to turn the total into figures finance will sign. A free calculator runs the whole thing.
Employee advocacy ROI is the value of the LinkedIn impressions a team's posts earn, set against what the program costs per person who actually publishes. The reach side is measurable: employees posting × posts each per month × the median reach of one post in their follower bracket.
That median runs from 192 impressions for employees under 1K followers to 12,181 above 100K (MagicPost benchmark, 24,420 posts). On the cost side, LinkedIn puts the share of employees who ever share company content at about 3%, so a per-enrolled-head plan costs 33 times its sticker price per publisher.
Convert impressions with the CPM you already pay for LinkedIn ads, then attribute pipeline in your CRM. Everything else in a vendor's ROI slide is a coefficient nobody can verify.
The employee advocacy ROI formula, measured rather than assumed
The formula behind our LinkedIn employee advocacy simulator has three inputs and no hidden coefficient:
Impressions per month = employees who post × posts each per month × median reach of one post in their follower bracket.
Two of those inputs are decisions you already control. You know how many people will genuinely publish (the people who will show up, a smaller number than your headcount) and how often you can hold them to it. Four posts a month is a rhythm most teams can sustain.
The third input is the one no program manager can guess, and the one every ROI slide guesses anyway: how far one post from an ordinary employee travels. We measure it instead.
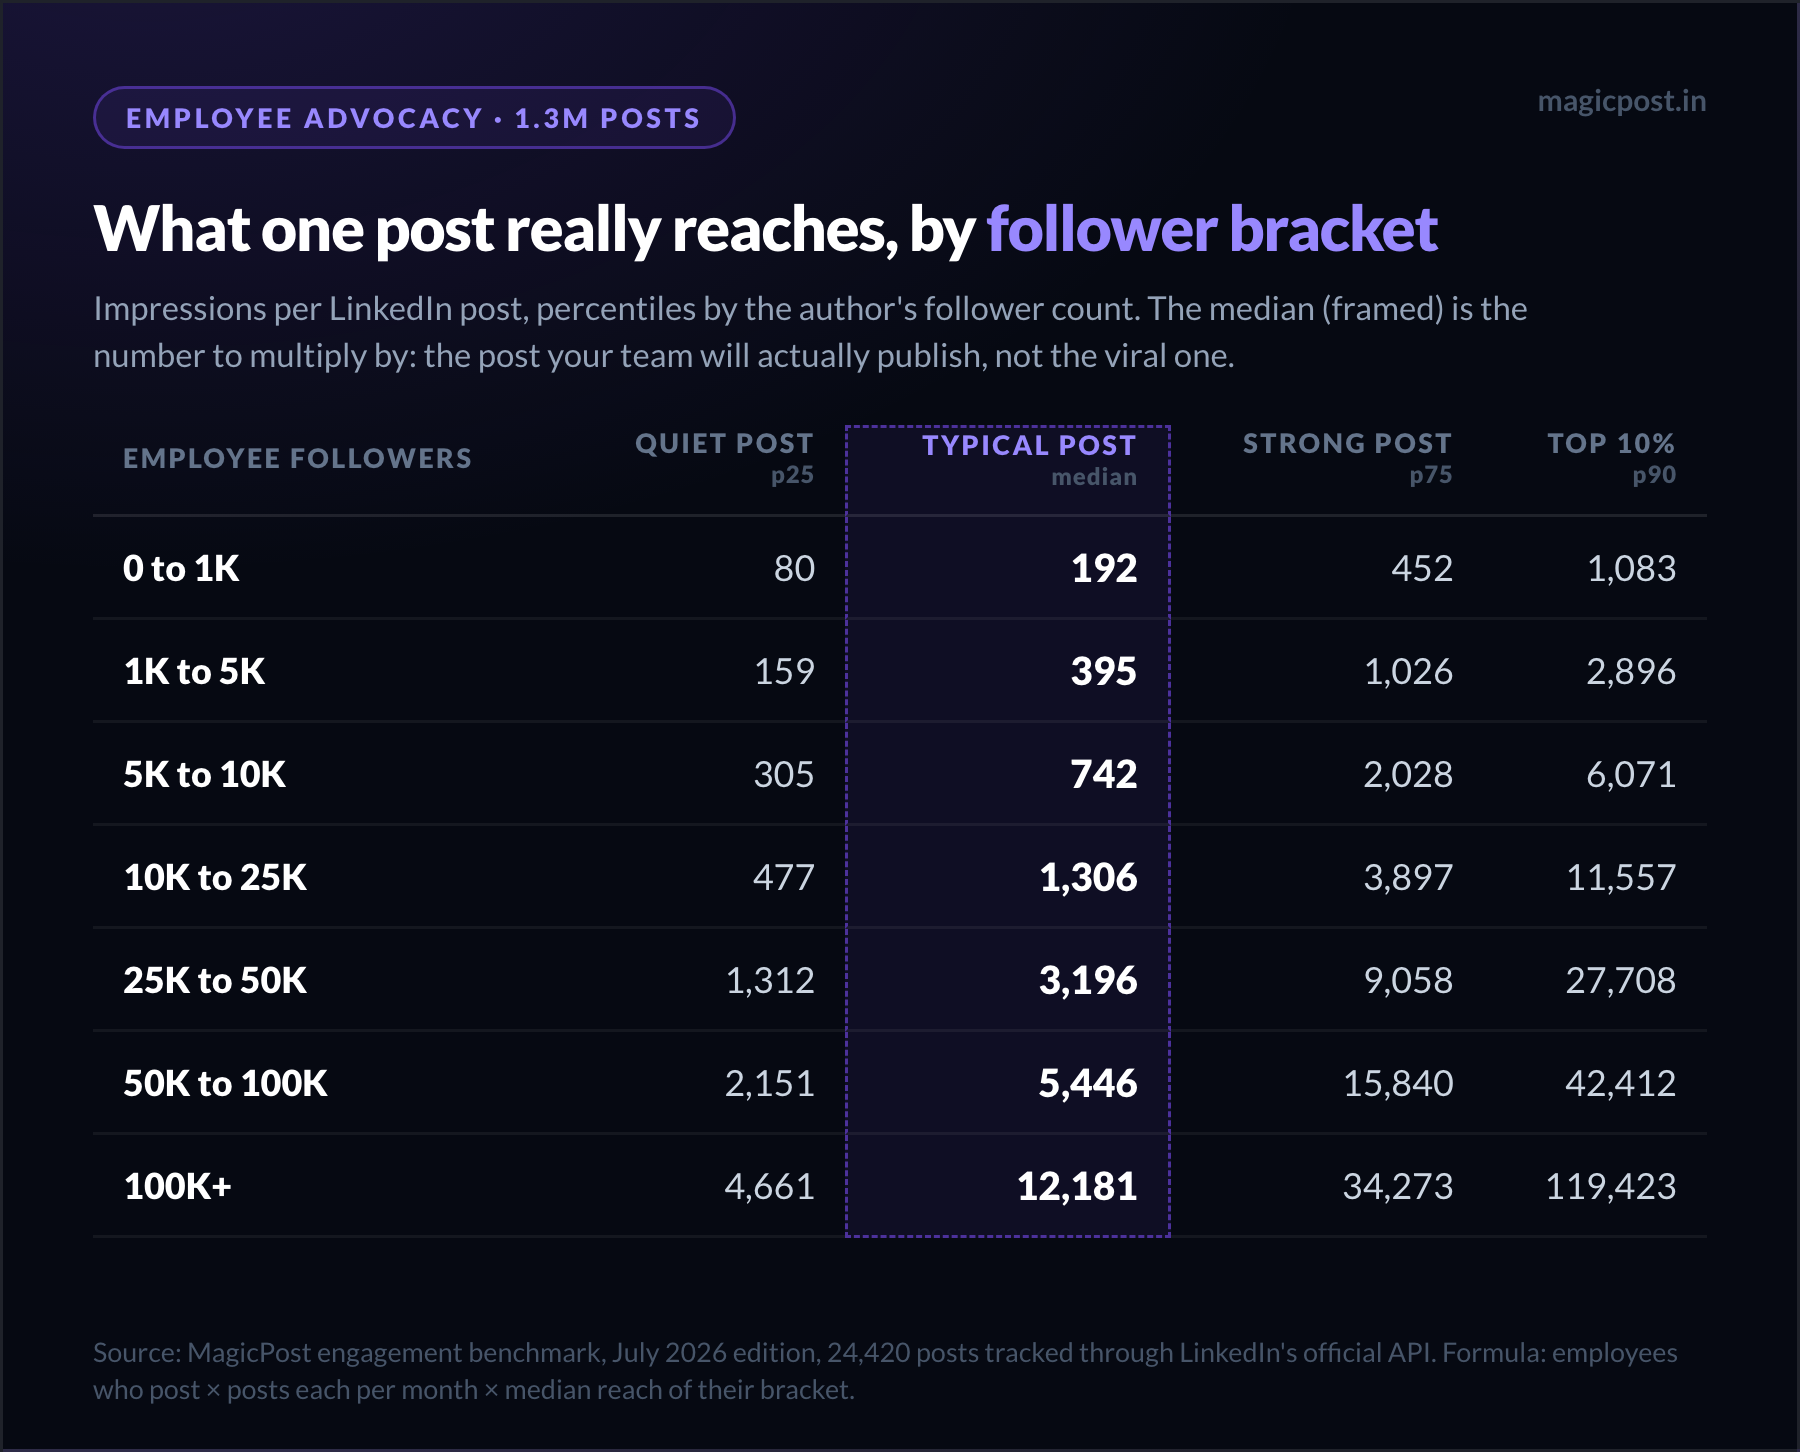
MagicPost aggregates the impressions of LinkedIn posts published by people who track their stats with us, groups them by the author's follower count, and summarizes each bracket with percentiles. The edition used on this page covers 24,420 posts.
Employee followers | Quiet post (p25) | Typical post (median) | Strong post (p75) | Top 10% (p90) |
0-1K | 80 | 192 | 452 | 1,083 |
1K-5K | 159 | 395 | 1,026 | 2,896 |
5K-10K | 305 | 742 | 2,028 | 6,071 |
10K-25K | 477 | 1,306 | 3,897 | 11,557 |
25K-50K | 1,312 | 3,196 | 9,058 | 27,708 |
50K-100K | 2,151 | 5,446 | 15,840 | 42,412 |
100K+ | 4,661 | 12,181 | 34,273 | 119,423 |
Worked example. A 25-person team where the typical employee sits mid-bracket at 1K-5K, each posting four times a month: 25 × 4 × 395 = 39,500 impressions in a typical month. A quiet month at the p25 value gives 15,900; a strong one at p75 gives 102,600.
Those three figures are the range a program of that size should plan on. The number you defend internally is the middle one.
The simulator interpolates between brackets on a log scale, so an employee with 1,200 followers gets a value between the 0-1K and 1K-5K medians (314 impressions) rather than a jump at the bracket edge. Your result will sit close to the table, rarely exactly on it.
Why employee advocacy reach depends on follower brackets
Reach on LinkedIn scales with the author's audience, and the scale is steep. Each bracket roughly doubles the median of the one below it, and the top bracket earns 63 times the bottom one.
That gradient is why the bracket matters more than any other assumption. Your CEO may sit at 25K-50K followers and earn 3,196 impressions on a typical post. Your account managers sit at 0-1K or 1K-5K and earn 192 to 395.
A calculator that pre-fills "average views per post" at 11,500 applies the median of a 100K+ account to every employee: 25 people posting ten times a month prints 2,875,000 impressions, a figure no team of account managers reaches.
The fix is to replace the guess with the measured value for the bracket your employees actually occupy.
Why the employee advocacy ROI formula uses the median post, not the average
The average is pulled upward by a handful of viral posts. In the 100K+ bracket the top 10% of posts clear 119,423 impressions while the median sits at 12,181, a tenfold gap inside one bracket.
Averaging a distribution shaped like that lands you well above what a typical post will do. The median is the post your team will actually publish next Tuesday. Multiplying by it keeps the estimate conservative by construction.
Two more refusals are built into the formula. It adds up impressions, not people: colleagues share much of the same audience and the overlap is not measured. And it carries no engagement multiplier and no amplification bonus, so every term is one you can check against the table above.
Employee advocacy cost per active poster: why price per seat lies
The reach side of employee advocacy ROI is now a measured number. The cost side is where the arithmetic goes wrong, because vendors price per enrolled employee and employees do not publish per enrollment.
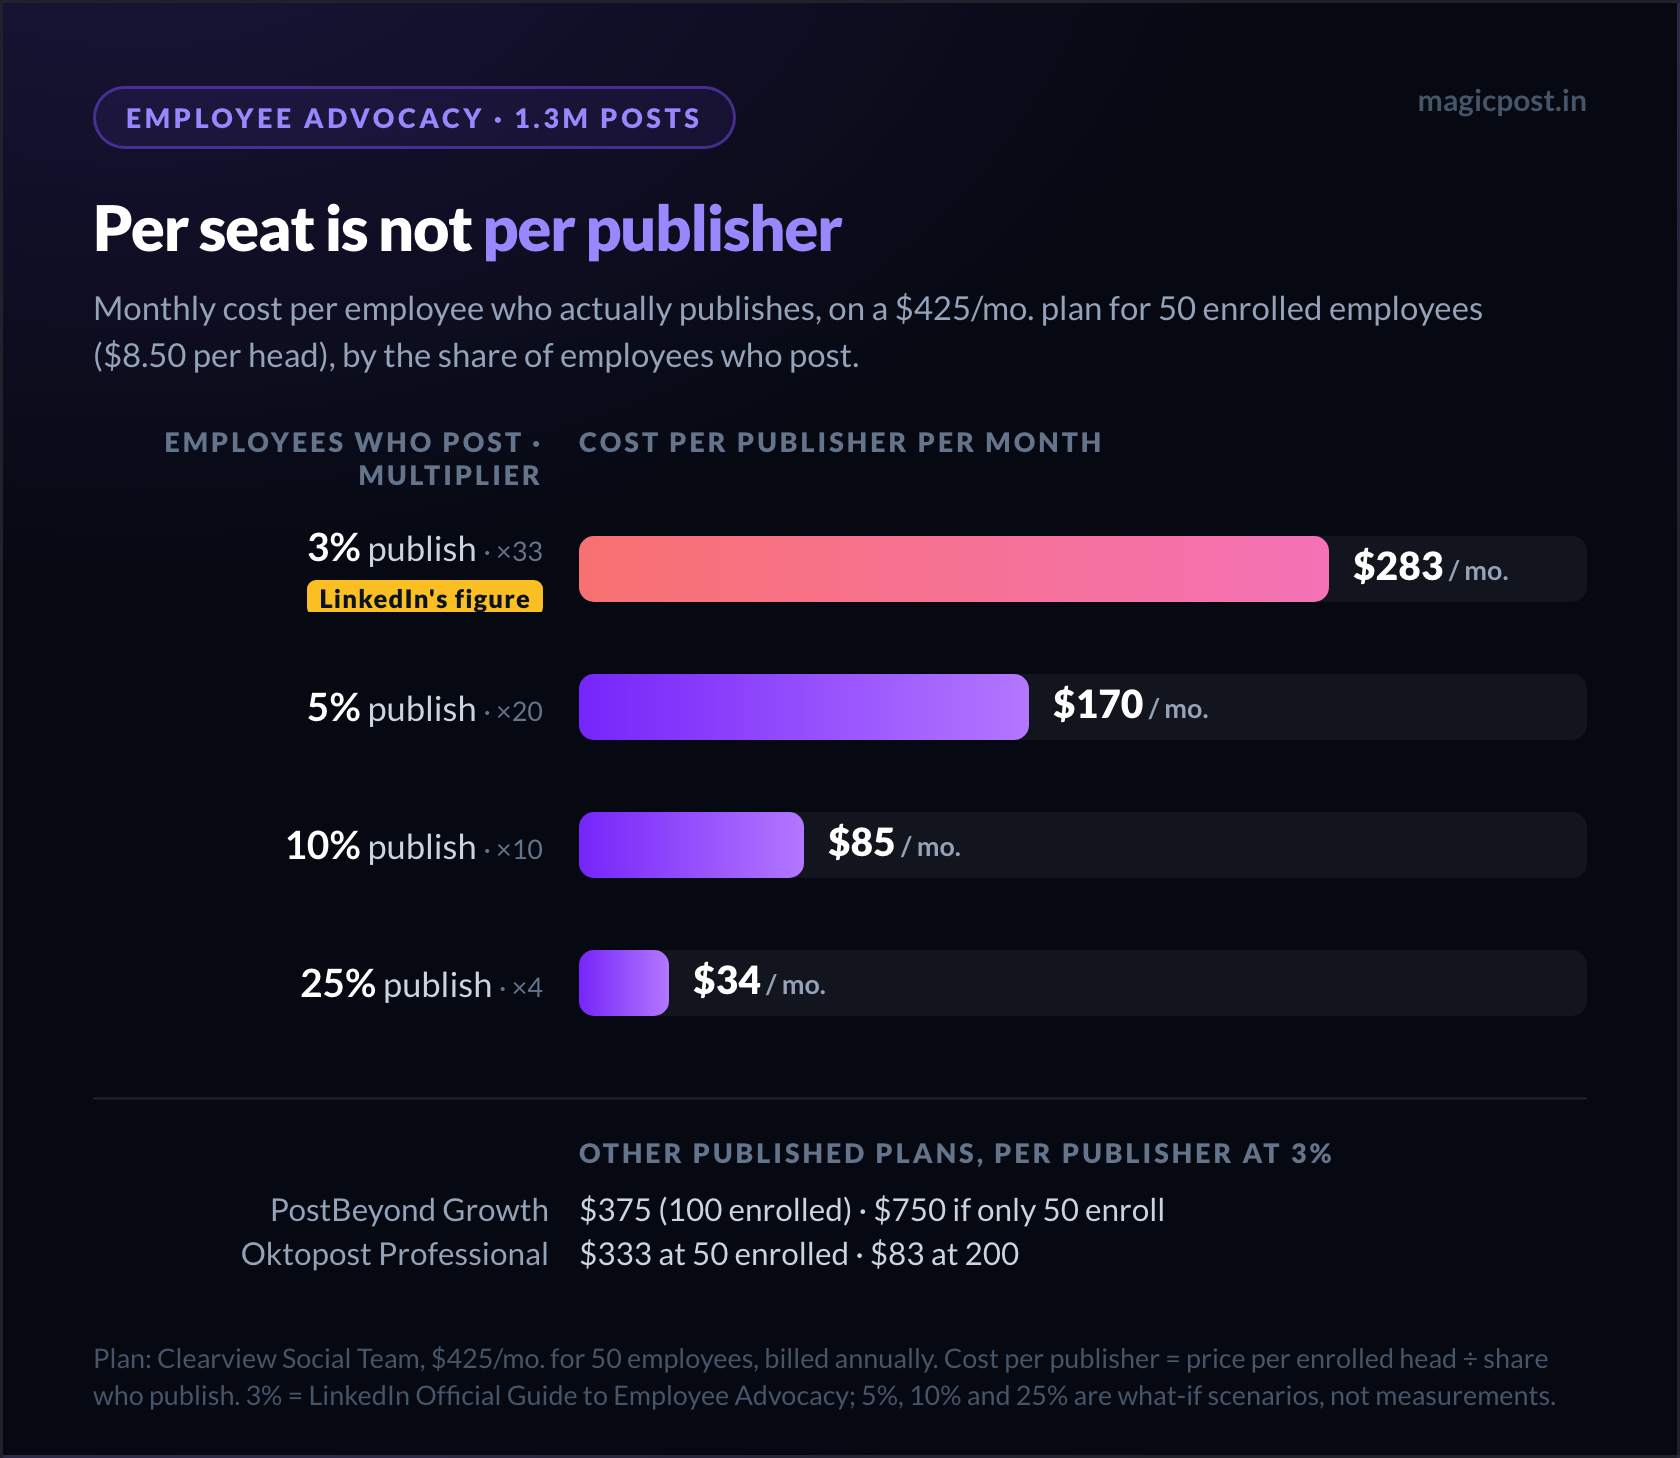
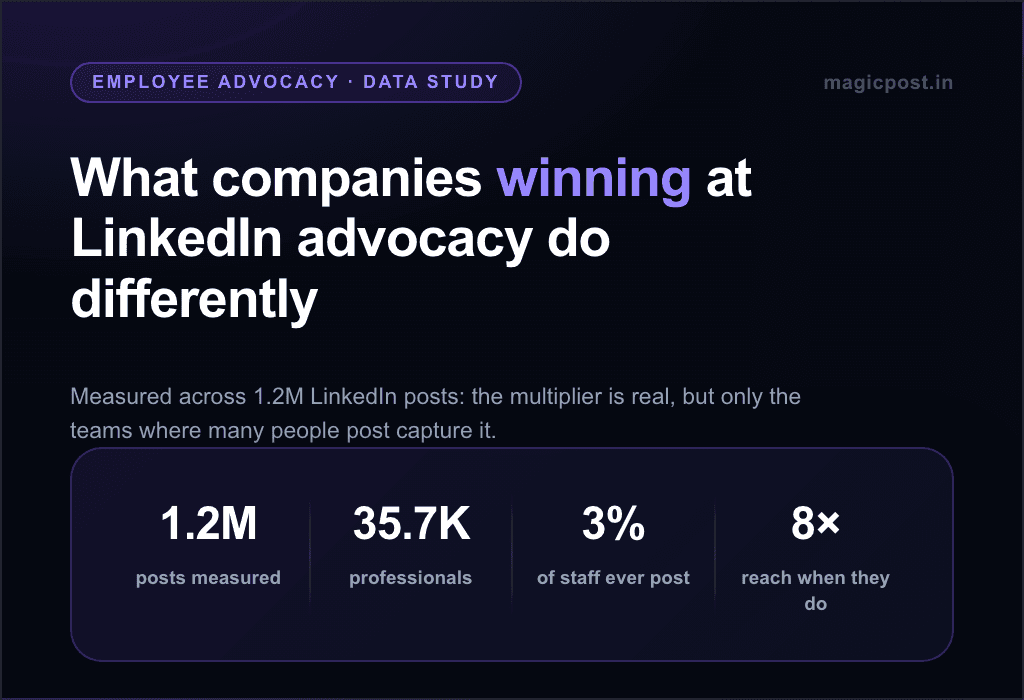
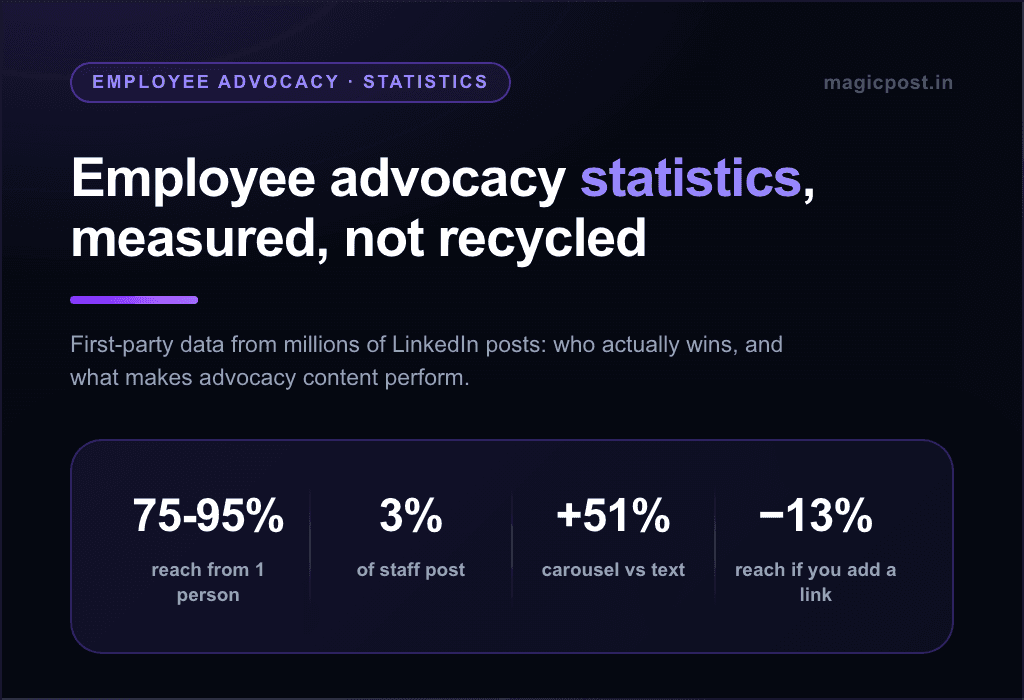
LinkedIn's Official Guide to Employee Advocacy puts the share of employees who ever share content about their company at about 3%. That figure is LinkedIn's, and it is the one to plan on until your own program proves otherwise.
At 3%, one publisher stands behind every 33 enrolled seats. The conversion is therefore:
Cost per publisher per month = price per enrolled employee ÷ 0.03, about ×33.
Never divide the invoice by a participation number you hope for. Multiply the per-head price by 33, then negotiate the multiplier down with evidence. Applied to the published plans on the market:
Plan | Published price | Per enrolled employee | Per publisher at 3% |
Clearview Social Team (50 employees) | $425/mo. | $8.50 | $283 |
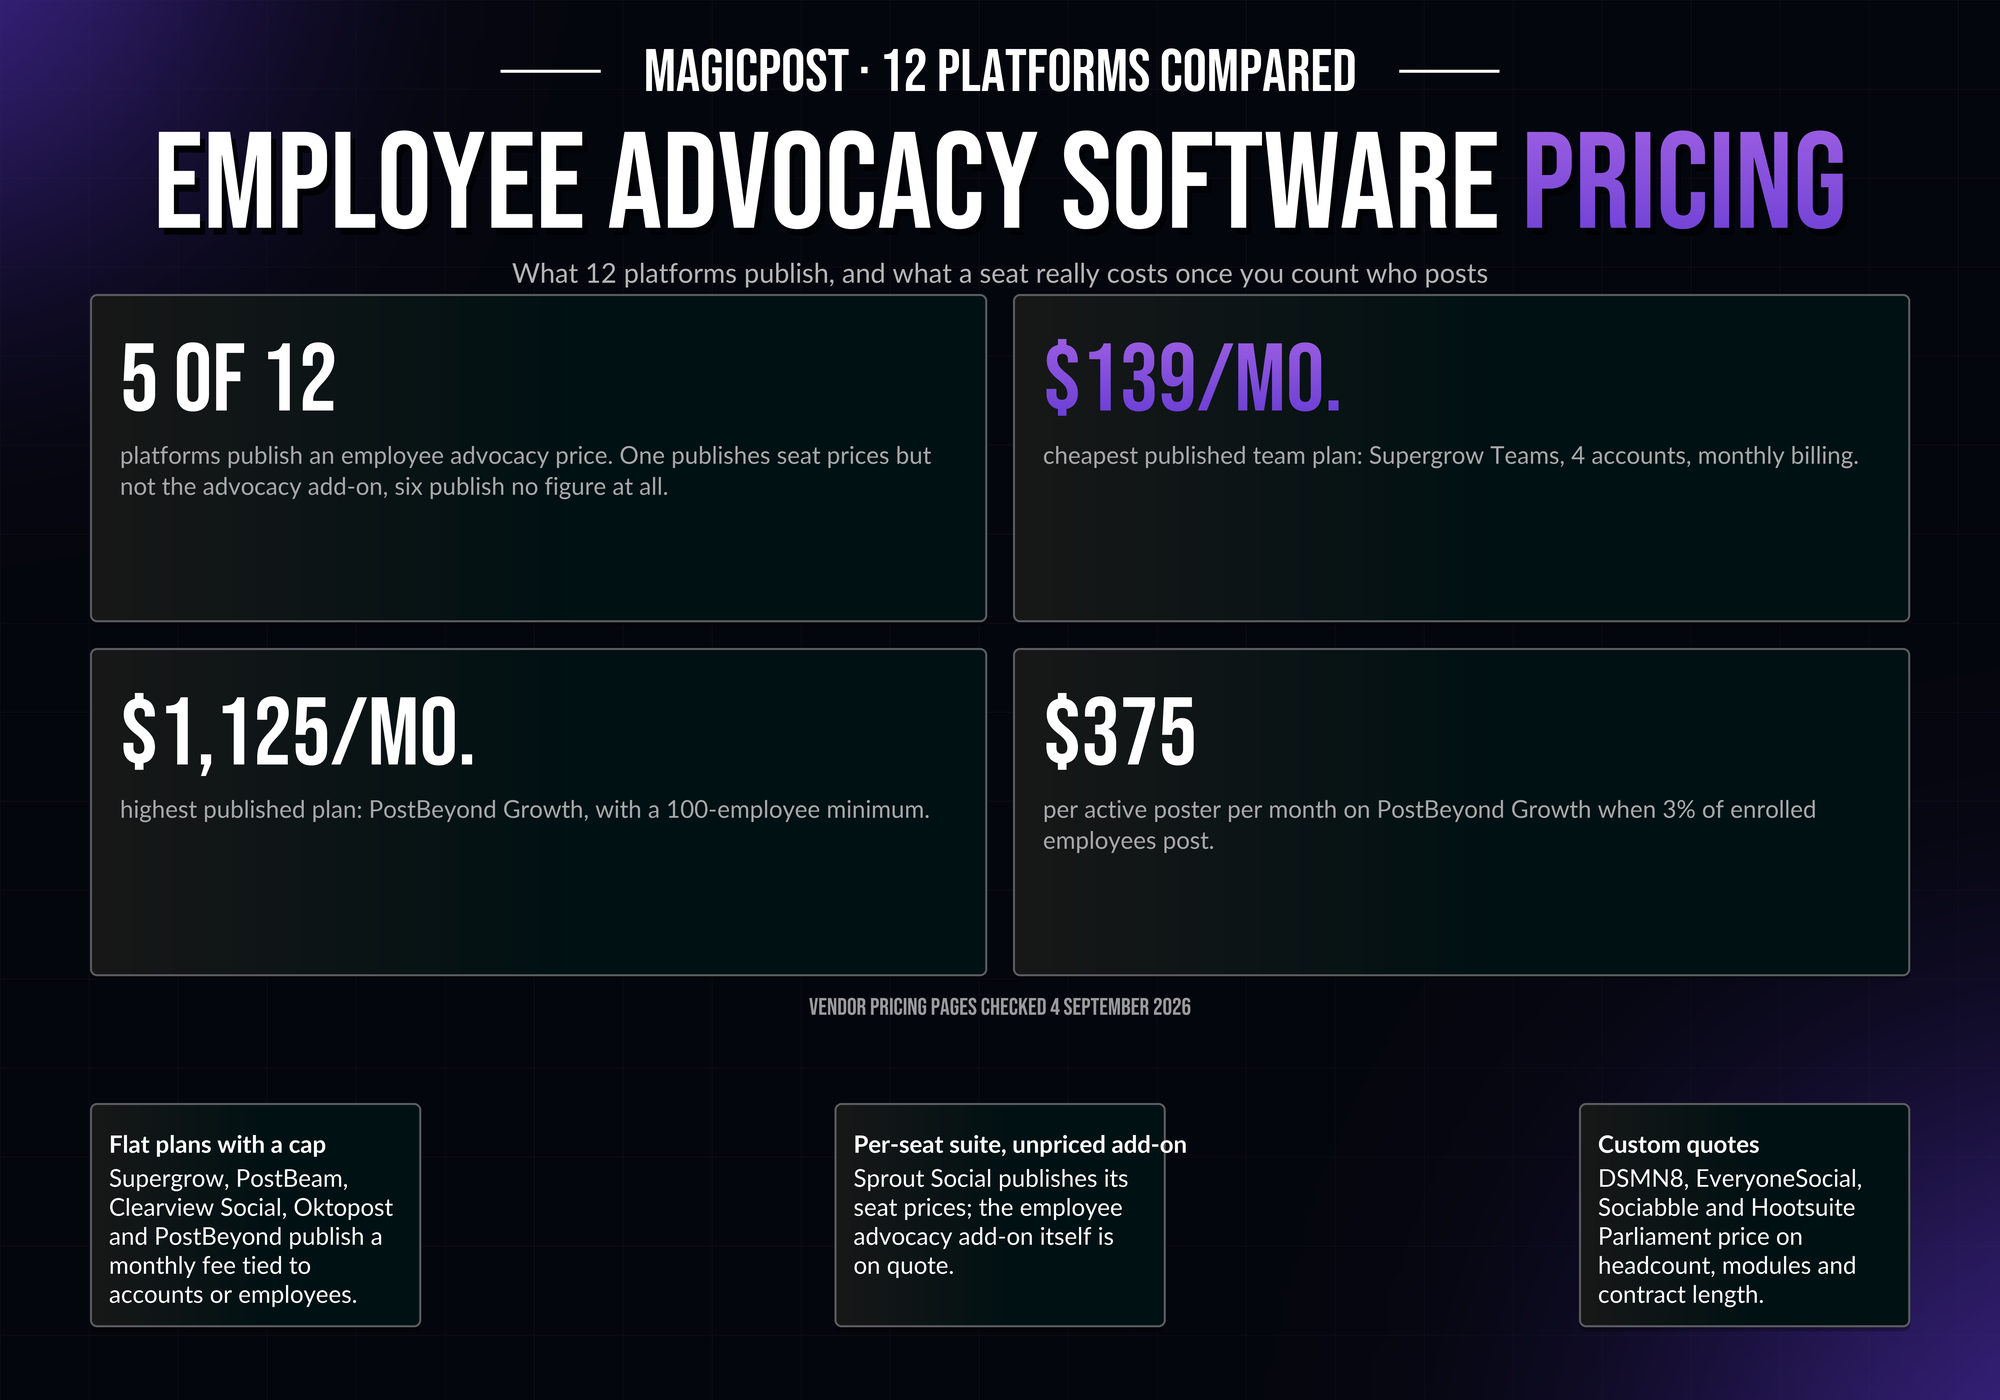
PostBeyond Growth (100 minimum) | $1,125/mo. | $11.25 | $375 |
Oktopost Professional, at 50 enrolled | from $499/mo. | $9.98 | $333 |
Oktopost Professional, at 200 enrolled | from $499/mo. | $2.50 | $83 |
Supergrow Teams (5 accounts) | $199/mo. | account = publisher | $39.80 |
MagicPost Team (2 seats) | $118/mo. | seat = publisher | $59 |
Clearview Social and Oktopost bill annually, so the monthly figures are commitments, not trials. PostBeyond's minimum cuts both ways: enroll only 50 employees and the plan still bills 100, so the cost per publisher doubles to $750.
Oktopost publishes a floor and no headcount tier, which is why the same $499 reads as $333 per publisher at 50 enrolled and $83 at 200. The final figure is a quote either way. If the quote is the sticking point, most alternatives to Oktopost publish an entry price.
Supergrow Teams prices the account, not the payroll. Its $199/mo. covers 5 accounts, so the per-publisher cost is $39.80 if all five post, and the cap is the constraint: a sixth publisher means a custom quote.
MagicPost Team is sold per seat, $59/mo. per seat ($47 billed yearly) from 2 seats, with one seat per publishing member and none for admins. The cost per publisher is the seat price, whatever the headcount behind it.
The multiplier is the whole negotiation. On the Clearview Social Team plan, the same $425 works out like this:
Share of enrolled employees who publish | Multiplier on the per-head price | Cost per publisher per month |
3% (LinkedIn's figure) | ×33 | $283 |
5% | ×20 | $170 |
10% | ×10 | $85 |
25% | ×4 | $34 |
Three things move a vendor from the first row toward the last. Ask for:
the price per active publisher, not per seat
the publisher-to-enrolled ratio across the vendor's accounts
a true-up of any enrolled minimum after ninety days
Vendors that price per account or per publishing member skip the multiplier entirely, which is why they dominate the small-program end of the market. The roundup of employee advocacy software sorts the tools by that pricing model.
Employee advocacy ROI calculator
The simulator runs the reach formula above on live data and refreshes every month with the latest benchmark edition. It has two modes, and both are the same formula read in opposite directions.
Simulate a program. Set the number of employees who will post, their posting rhythm, and the follower count of a typical employee (a slider, deliberately labeled "not your top voice"). The result is a monthly total in four tiers, quiet to top 10%.
Hit a target. Enter the impressions you have to defend internally, and the simulator returns how many employees need to post to reach them at that rhythm and audience. It rounds up, since nobody recruits 0.4 employees, and stops at 500.
Past 500 the verdict changes: raise the rhythm or the audience rather than the headcount. That is the formula telling you which of its three terms is cheapest to move.
Take a target of 100,000 impressions a month, four posts each, employees in the 1K-5K bracket: 100,000 ÷ (4 × 395) = 63.3, so 64 employees posting. That is the number the calculator gives you.
The cost section turns it into a hiring question. At LinkedIn's 3% participation, 64 publishers means enrolling roughly 2,100 people. At 25%, roughly 256. The target mode tells you how many posters you need; the participation rate tells you how many seats you will pay for to get them.
The simulator also translates a posting round into a single-account equivalent, on the same median curve. For the 25-person example above, one round of posts travels as far as a single post from a 150,000-follower account. That comparison is the line that lands in an executive review.
Run the formula on your own team: open the free employee advocacy ROI calculator, switch to "Hit a target", and enter the number you have to defend.
Employee advocacy ROI in dollars: EMV, pipeline, and what finance accepts
Impressions are the unit the formula produces. Finance wants a currency. There are three conversions, in increasing order of credibility, and each needs a parameter you already own.
Earned media value (EMV). Divide the impressions by 1,000 and multiply by the CPM you actually pay for sponsored content in LinkedIn Campaign Manager. The 25-person example above, at 39,500 impressions, is worth 39.5 × your CPM per month.
Take the CPM from your last invoice, never from a vendor's ROI page. Campaign Manager CPMs vary by audience, geography and bidding, and the number that survives a finance review is the one on your own bill.
EMV answers one question: what would it cost to buy this reach as ads? It is cost avoidance, not revenue, and finance will treat it as such. It is also the only conversion available from month one.
Pipeline attribution. Leads that cite a colleague's post, demo requests with LinkedIn as the source field, comments and direct messages that turn into meetings. Track them where you already track sources, in the CRM, and report the pipeline value with its usual stage weighting.
Pipeline lags the impressions by your sales cycle. A program that starts posting in January will show reach in January and pipeline whenever your deals normally close.
The ROI line itself. (Value − program cost) ÷ program cost, where value is EMV in the first months and attributed pipeline once it exists. Program cost has two parts: the software cost per publisher from the section above, and content time.
Content time is hours per post × the loaded hourly rate of the people posting. A team that drafts from a shared brief and edits in its own voice spends far less of it than one writing from a blank page.
What finance accepts in each case:
Conversion | Parameter you supply | Counts as |
Measured impressions | None (analytics) | Reach |
EMV | Your Campaign Manager CPM | Cost avoidance |
Attributed pipeline | CRM source field, stage weighting | Revenue |
One rule ties the three together: the impressions in the ROI line must be measured, not simulated. The simulator sizes the plan; LinkedIn analytics for the whole team supply the number that goes into the spreadsheet, post by post, pulled through LinkedIn's official APIs.
Why most employee advocacy programs never reach ROI: one-person concentration
Return to the formula. Its first term is the number of employees who post. In most companies that number is one.
Within our research corpus of 1,333,072 LinkedIn posts by 39,729 professionals over a trailing twelve-month window, we measured the share of each company's advocacy reach produced by its single biggest poster.
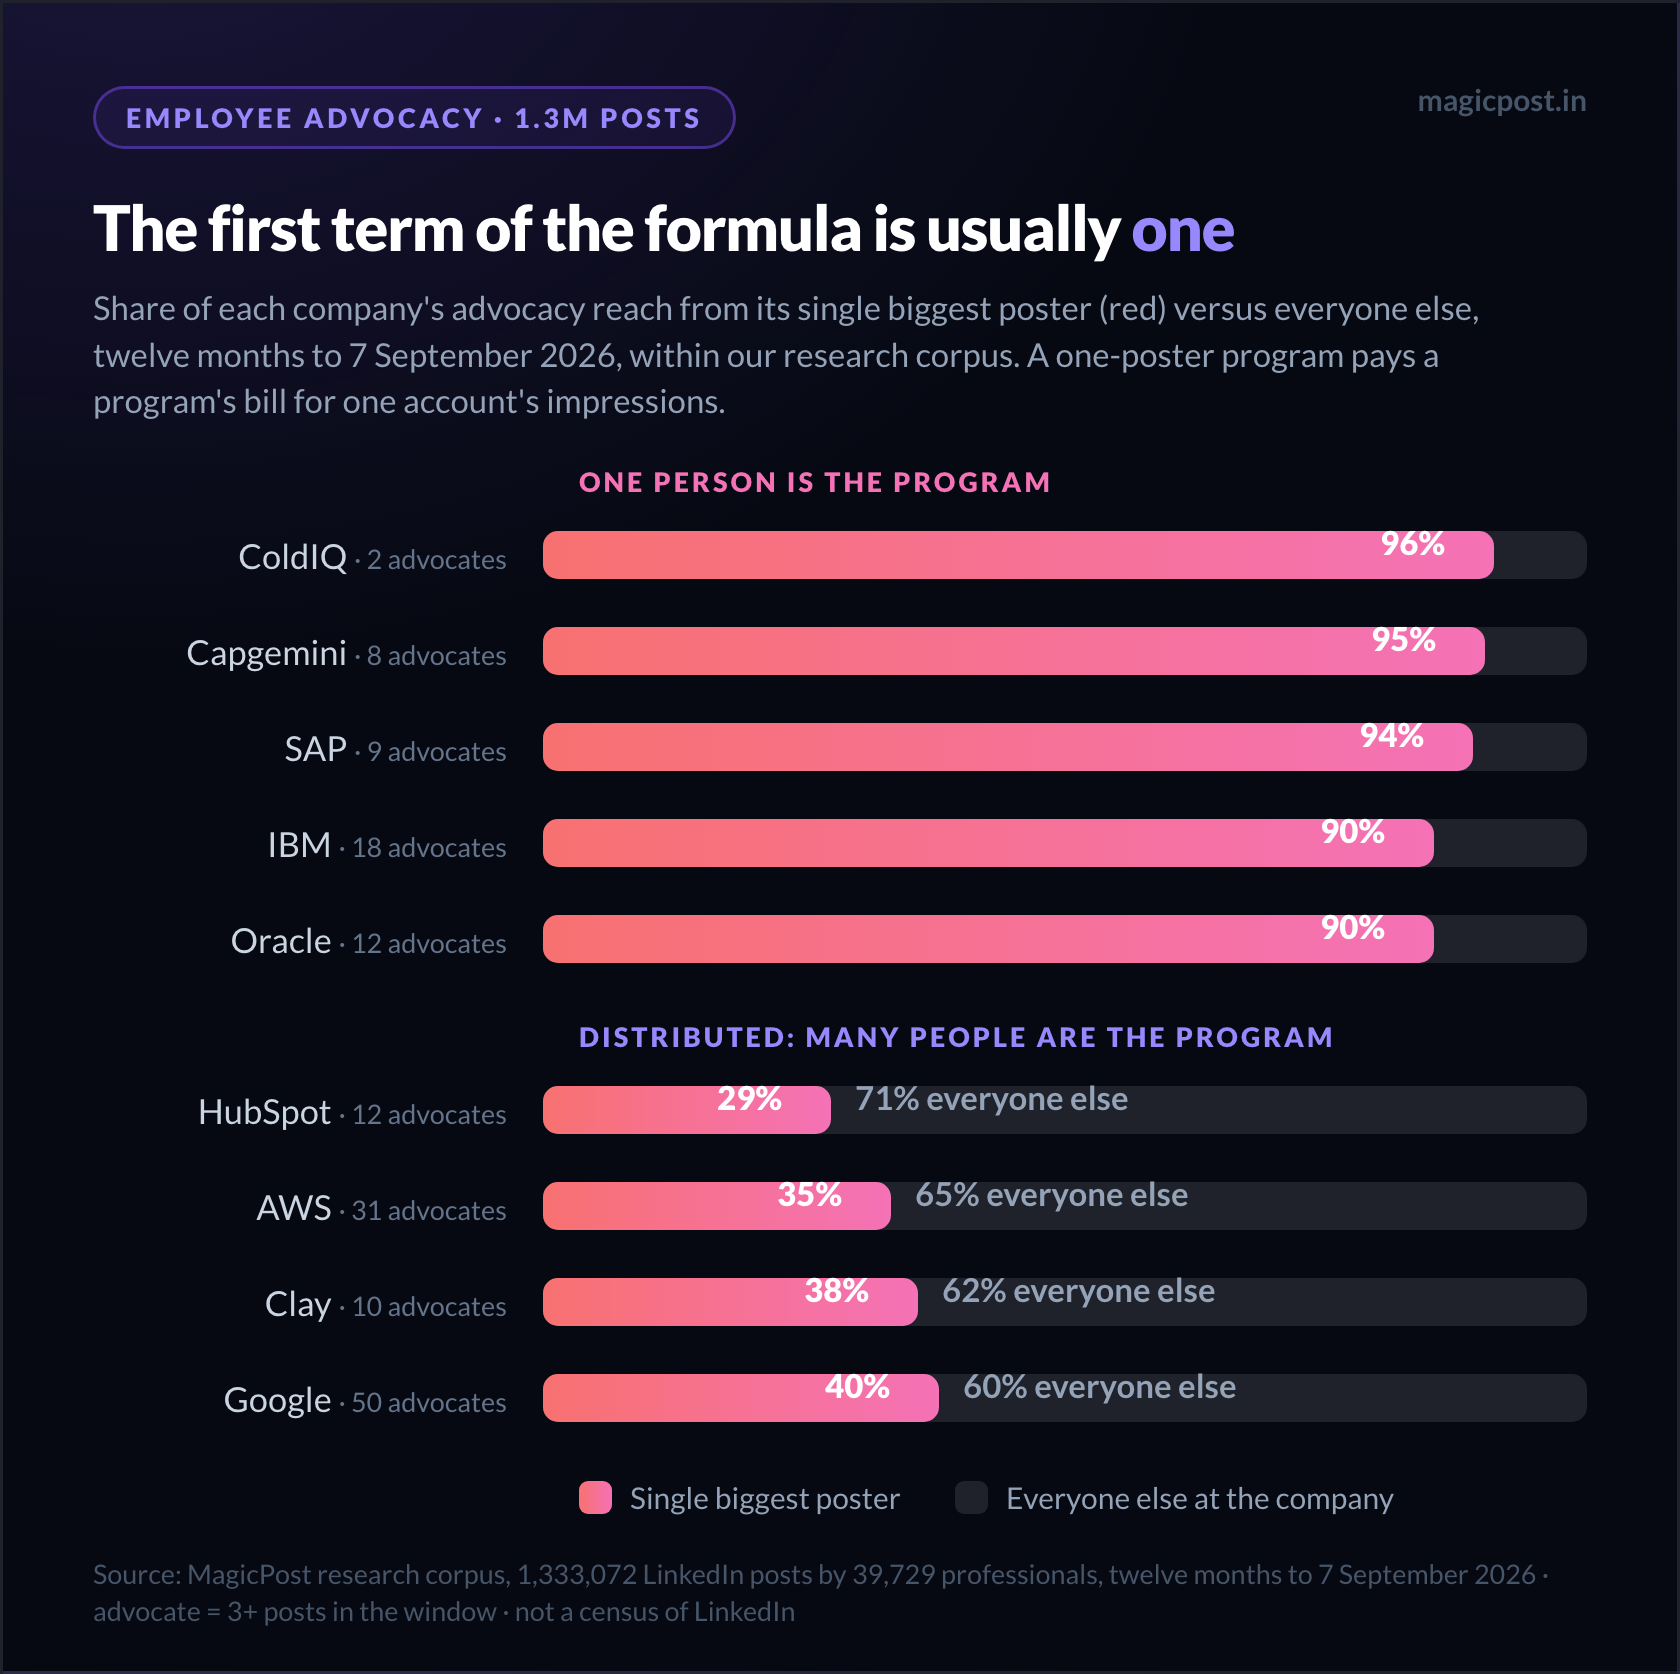
At ColdIQ that share is 96%; at HubSpot, the most distributed program of the set, it is 29%.
At the five most concentrated companies the top poster is the CEO, a founder or an evangelist at four of them, and a head of AIOps at IBM; the rest of the company is a footnote next to that person.
The distributed programs are rare enough to count on one hand. They are the companies whose first term in the formula is a real number rather than one.
Concentration breaks the ROI in three ways.
First, the arithmetic collapses. A program with one poster has the impressions of one account, and the software bill of a program. Every seat beyond that one is paid for and silent.
Second, the reach is not new reach. One executive's audience is the audience the company already had. Advocacy earns its return by reaching the networks of people the company page never touches, and a single poster reaches only their own.
Third, it is fragile. Salesforce sat at 29% in June, the most distributed program we measured. Its widest voice changed employer over the summer and the share jumped to 54%. ColdIQ went from five advocates at 63% to two at 96% when two of them moved on.
Those three effects are why participation, not headcount, is the variable that decides employee advocacy ROI. Microsoft has 63 advocates in the corpus and Clay 10, and Clay's median post earns three times the likes of Microsoft's.
The full study of advocacy across 1.3M posts covers who breaks the pattern, the statistics page carries the figures, and the measured case studies walk through the programs that hold a distributed shape.
One caveat on the corpus: MagicPost only sees the profiles it has imported, which skews the sample toward software, GTM and large tech. A company missing from the leaderboard may never have been imported, so absence is not a verdict. Every company figure reads "within our research corpus".
The corpus cannot measure participation rates either: it only contains people who post. That is why the 3% figure above is LinkedIn's and not ours.
Getting from one poster to many is a separate problem, with its own data on what moves participation from 3% toward 10%. It has its own guide: employee advocacy adoption, why 97% never post.
Measure employee advocacy ROI with a platform priced per publisher
Every input in the formula is now something you can source: measured reach per bracket, a cost per publisher instead of a sticker price, a CPM from your own invoices, and a participation rate you can watch rather than assume.
MagicPost is the employee advocacy platform built around that last variable. Each member gets a workspace with their own AI settings, calendar and history, and the AI drafts in that person's voice within the organization's guidelines, because generic content reaches fewer people.
Admins manage content, schedule and approvals for any member without consuming a seat. The team dashboards report total impressions, followers gained and top performers, the measured numbers the ROI line needs, and adoption monitoring shows who is posting and who has gone quiet before the participation rate does.
The Team plan costs $59/mo. per seat, from 2 seats, one seat per publishing member, pay as you grow. The full comparison of what 12 platforms charge, and what each one costs per person who publishes, is in the employee advocacy software pricing guide.
FAQ
How do you measure employee advocacy ROI?
Employee advocacy ROI is measured as (value − program cost) ÷ program cost. Value starts as earned media value, measured impressions ÷ 1,000 × the CPM you pay for LinkedIn ads, and becomes attributed pipeline once LinkedIn-sourced leads close. Program cost is software per publishing employee plus content time.
What is a good employee advocacy participation rate?
A good employee advocacy participation rate is anything above the 3% baseline LinkedIn reports in its Official Guide to Employee Advocacy. Concentration is the better test: in MagicPost's research corpus, distributed programs (HubSpot, AWS, Clay, Google) keep the top poster under 40% of reach; at 16 of the 24 curated companies one person produces the majority of it.
How do you calculate earned media value for employee advocacy?
Earned media value for employee advocacy is impressions ÷ 1,000 × CPM. Take the impressions your employees' posts actually earned, from analytics, and the CPM on your own Campaign Manager invoices. A team earning 39,500 impressions a month has an EMV of 39.5 × that CPM, as cost avoidance, not revenue.
How much does an employee advocacy program cost per employee?
An employee advocacy program costs $8.50 to $11.25 per enrolled employee per month on published plans (Clearview Social Team, $425/mo. for 50; PostBeyond Growth, $1,125/mo. for 100). Per employee who actually publishes, at LinkedIn's 3%, multiply by 33: $283 to $375 a month. Seat-per-publisher plans like MagicPost Team skip it.
How long does employee advocacy take to show ROI?
Employee advocacy shows reach within the first month of posting, since impressions accrue within days of each post, so earned media value can be reported from month one. Pipeline follows your sales cycle: deals sourced in January close when January deals normally close. The usual bottleneck is participation rather than time.
What metrics should an employee advocacy program track?
An employee advocacy program should track five metrics: employees who published this month (participation), posts per publishing employee (rhythm), measured impressions per post against the benchmark for their follower bracket, the share of reach from the biggest poster (keep it under 40%), and CRM pipeline with a LinkedIn source.
Is employee advocacy worth it for small companies?
Employee advocacy is worth it for small companies that price per publisher. Ten employees in the 1K-5K bracket posting four times a month earn about 15,800 impressions, and lifting participation against headcount is far easier in a team of ten than in a company of 5,000. Pick tools priced per account or publishing member (Supergrow Teams, MagicPost Team).