" height="26.80529977783203px" id="tymKb8bqC" width="128.00300311279295px"/><path d="M 0 2.417 L 0 0 L 12.909 0 L 12.909 2.417 Z" fill="rgb(126, 78, 253)" height="2.417099999999998px" id="aYr4em6zK" transform="translate(128.341 22.325)" width="12.908999999999992px"/></svg>)
"/><stop offset="1" stop-color="rgb(118, 37, 250)"/></linearGradient></defs><g d="M 19.242 21.22 L 19.362 6.204 L 19.272 6.204 L 13.757 21.22 L 10.161 21.22 L 4.796 6.204 L 4.706 6.204 L 4.825 21.22 L 0 21.22 L 0 0 L 7.283 0 L 12.109 13.607 L 12.229 13.607 L 16.844 0 L 24.247 0 L 24.247 21.22 Z M 26.421 26.113 L 26.421 23.445 L 41.407 23.445 L 41.407 26.113 Z" fill="transparent" height="26.112508199679183px" id="DvfaAIHYn" width="41.40731898311435px"><path d="M 19.242 21.22 L 19.362 6.204 L 19.272 6.204 L 13.757 21.22 L 10.161 21.22 L 4.796 6.204 L 4.706 6.204 L 4.825 21.22 L 0 21.22 L 0 0 L 7.283 0 L 12.109 13.607 L 12.229 13.607 L 16.844 0 L 24.247 0 L 24.247 21.22 Z" fill="rgb(46, 46, 46)" height="21.220180016149442px" id="pLsxRCobd" width="24.247352589074694px"/><path d="M 0 2.668 L 0 0 L 14.986 0 L 14.986 2.668 Z" fill="url(%23yD9d4I5GR-3279285344-linear-gradient)" height="2.6675085048549647px" id="yD9d4I5GR" transform="translate(26.421 23.445)" width="14.986002836263765px"/></g></svg>)

Diane Massé
Product Specialist
Ever wondered which of your LinkedIn posts are actually working? Or why some posts blow up while others barely get noticed? That’s where MagicPost Metrics comes in. Think of it as your LinkedIn performance control center, giving you deep insights into your content so you can double down on what works.
Here’s everything you need to know 👇
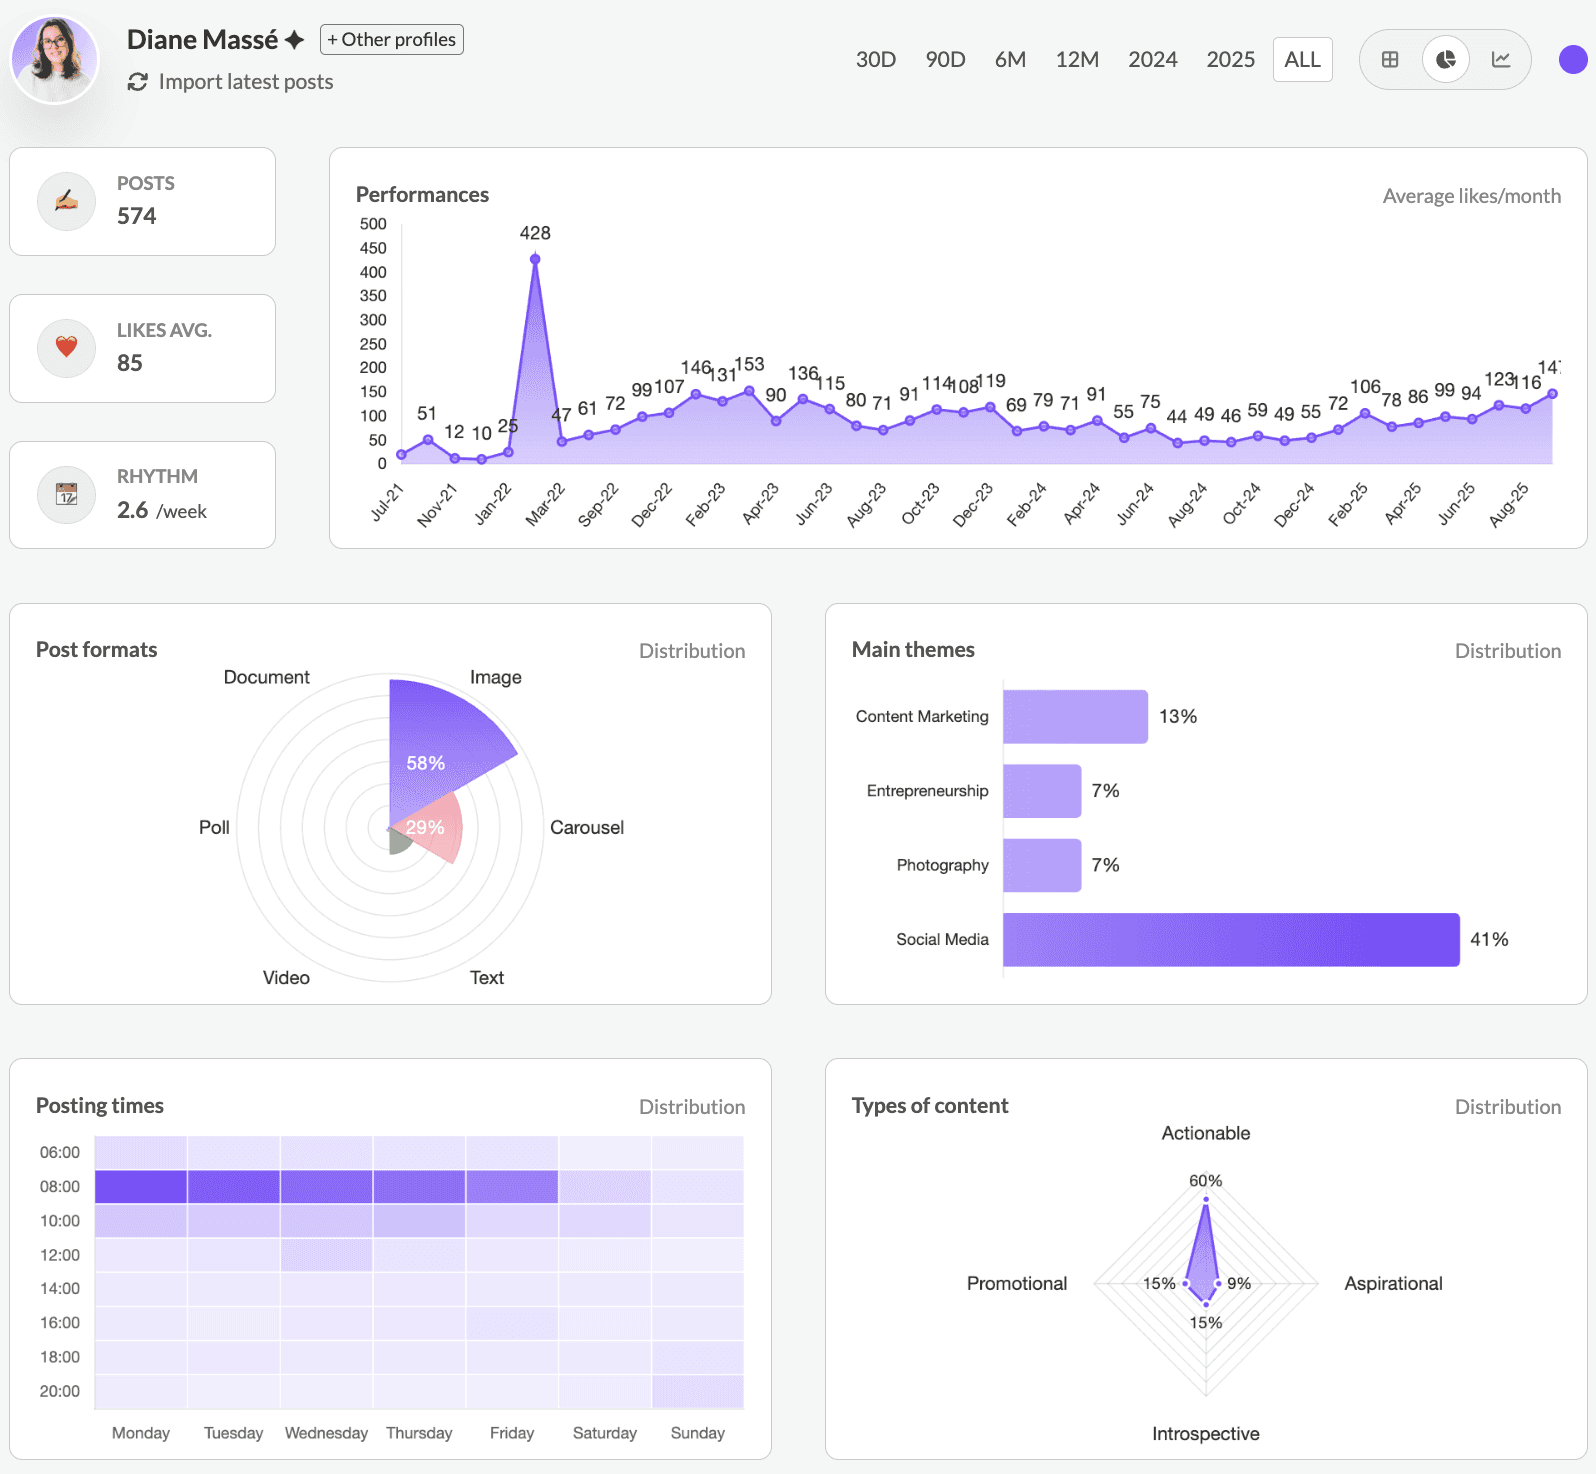
1. What can I track with MagicPost Metrics?
MagicPost gives you a full breakdown of your LinkedIn content, covering:
✅ Your overall performance – Likes, engagement, and posting frequency
✅ Post formats – Are your carousels killing it, or is video your secret weapon?
✅ Best posting times – Find out exactly when your audience is most active
✅ Main content themes – What topics resonate the most?
✅ Content types – Are your posts more actionable, aspirational, or promotional?
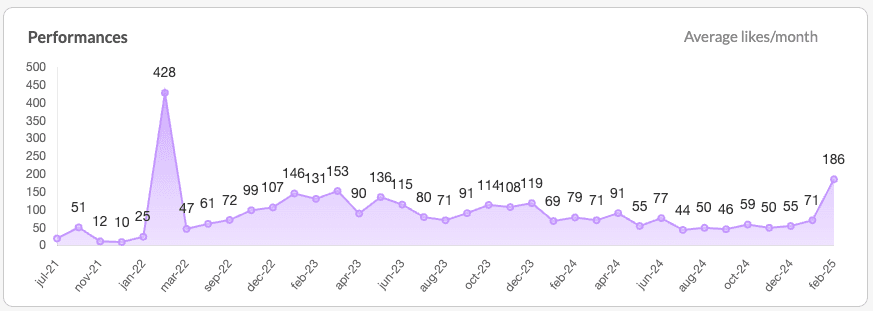
2. How do I use the Performance Graph?
The performance graph gives you a month-by-month view of your average likes per post. This helps you spot trends and anomalies – like that one post that randomly went viral (time to analyze why it worked).
You can filter data by:
30D, 90D, 6M, 12M, or ALL-TIME to compare different periods
Specific posts to see what caused spikes in engagement
3. What’s the best format to post on LinkedIn?
MagicPost tracks which post formats work best for you:
Carousels – Often the top-performing format, perfect for storytelling
Images – Great for catching attention quickly
Videos – Powerful for engagement, but needs a strong hook
Text-only posts – Still work, but might not be as visually appealing
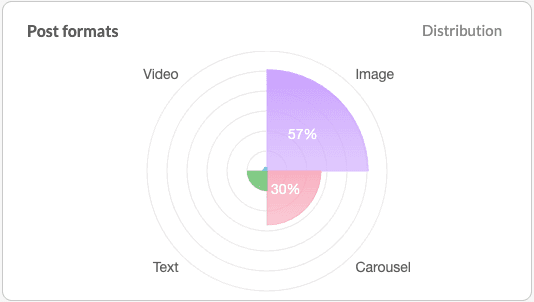
If your carousels are outperforming everything else, it’s a sign to double down on them.
4. What’s the best time and day to post?
Ever posted at 3 PM and got crickets? Timing matters more than you think.
MagicPost analyzes your historical data and reveals:
The best days to post (Hint: Sunday might be a winner)
The best hours for engagement (Turns out, 8 AM or 8 PM could be prime time)
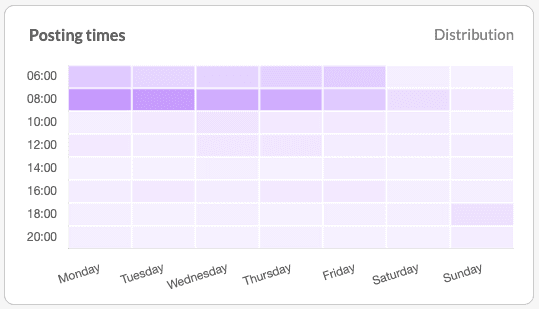
This lets you schedule your posts strategically for max impact.
5. What topics resonate the most?
Knowing what to talk about is just as important as how you say it.
MagicPost identifies your top-performing themes. For example:
Social Media: might be your biggest engagement driver
Content Marketing: could be gaining traction
Entrepreneurship: could be worth exploring more
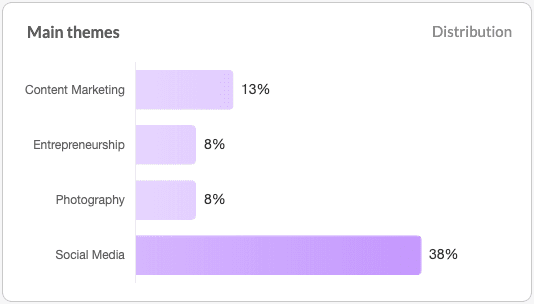
If one theme is getting consistently higher likes, it’s a sign to lean into that topic.
6. What makes a post go viral?
MagicPost analyzes your best-performing posts and reveals common patterns. For example:
✅ Best Format – Carousels seem to be the top performer
✅ Best Day – Sunday posts get the most engagement
✅ Best Time – 8 PM posts tend to perform best
✅ Best Hook Type – Posts using numbers/statistics attract the most clicks
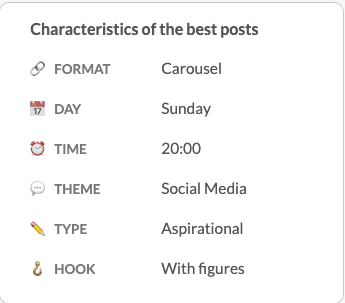
This helps you replicate your success instead of guessing what works.
7. How can I improve my LinkedIn content using Metrics?
Here’s how you can use MagicPost’s insights to level up your content:
Post more of what works – Double down on formats and themes that drive the most engagement
Time it right – Schedule your content when your audience is most active
Experiment strategically – Try new post types, but track the results
Refine based on data – Use the insights to tweak your style and stay ahead
8. Where can I find Metrics in MagicPost?
Easy! Just go to Metrics in the left sidebar and start exploring.
Got any questions? Drop them in the chat – we’re happy to help!
Updated